Dogecoin Tests Critical Support as ETF Speculation Meets Six-Month Lows

Market Structure Shifts Lower
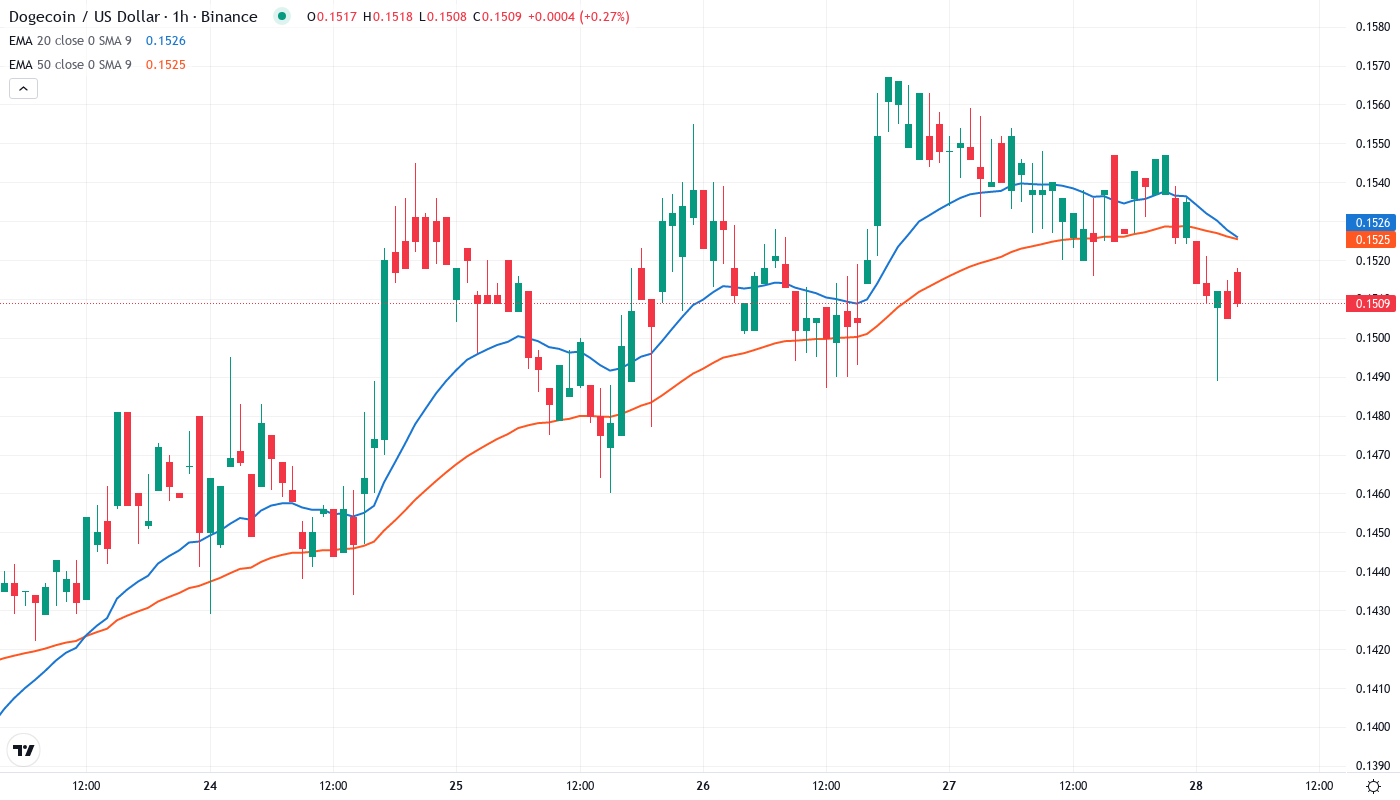
- DOGE dropped 21.7% to $0.1509, its lowest level since August, marking a sixth consecutive week of selling.
- Technical indicators show bears in control: all major moving averages act as resistances, with RSI and ADX signaling oversold and mature downtrend conditions.
- Key support at $0.15 and $0.098; immediate resistances at $0.158 (20-day EMA) and $0.183, with potential relief bounce toward $0.165–0.170.
This week, DOGE dropped by 21.7% to $0.1509, the lowest level we’ve seen since August. Despite talks about ETF filings, we still saw the sixth week of continued selling. The technical structure clearly shows that bears have taken the lead, as all the major moving averages are working as resistances.
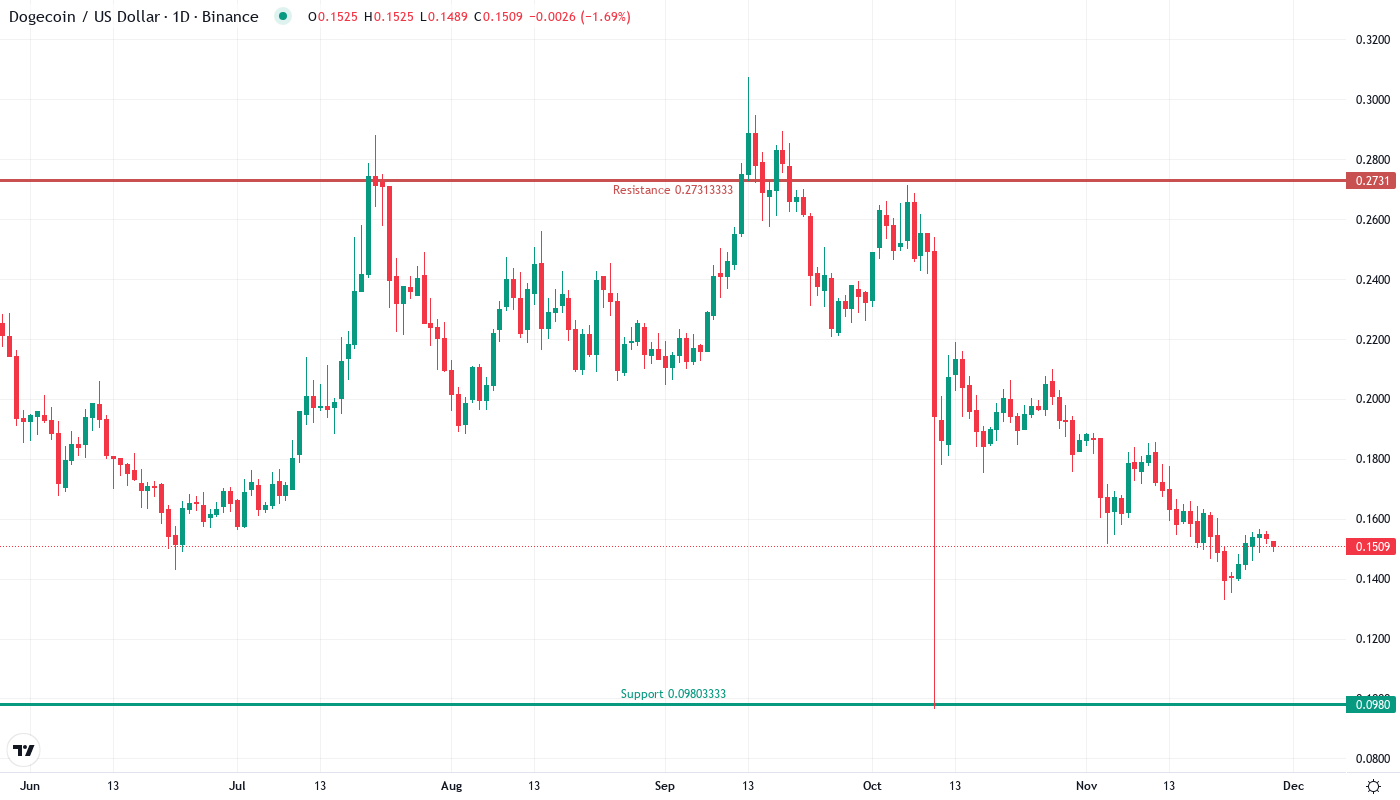
Dogecoin has plunged below its yearly lows to open the door to a further nosedive. Sellers prevailed once $0.18 was taken out, and the plunge back through the yearly lows leaves the top coin fighting for its life. With the nearest resistance a long distance away at $0.20 and the flat 200 EMA around $0.21, extended consolidation is a long way off. A move higher out of the danger zone would require a recovery through $0.18, but all failing doors become resistance, so we would likely see a selloff to test critical support near $0.15 first.
| Metric | Value |
|---|---|
| Asset | DOGECOIN (DOGE) |
| Current Price | $0.15 |
| Weekly Performance | 1.14% |
| Monthly Performance | -21.73% |
| RSI (Relative Strength Index) | 40.8 |
| ADX (Average Directional Index) | 40.8 |
| MACD (MACD Level) | -0.01 |
| CCI (Commodity Channel Index, 20-period) | -52.07 |
Momentum Exhaustion Signals Capitulation – RSI Drops Below 41
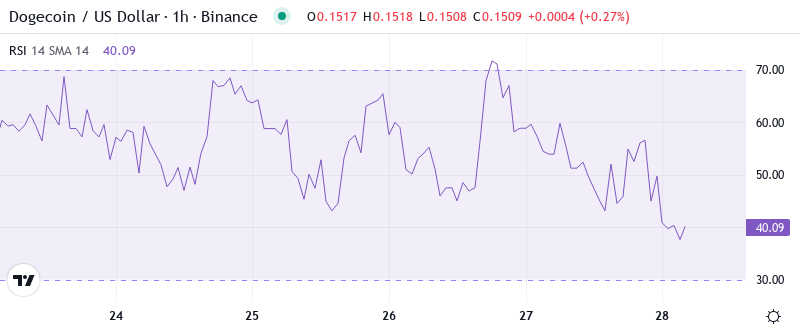
The RSI is at 40.83 on the daily and is officially dipping into oversold conditions for the first time since the August low at $0.08. This was the same reading as the exhaustion phase before the 140% run-up to the November high, but obviously, the market structure is very different, added to that the whole of crypto is under pressure.
What is interesting to note is that the Relative Strength Index (RSI) hardly moved even after news of the Wall Street DOGE ETF filing, which would usually trigger some sort of positive reaction. As a swing trader, this indicates that momentum in response to this news has been muted, implying that potential relief rallies will likely be met with selling pressure before even reaching the 50 RSI mark. The weekly RSI at 39.90 cements the fact that weakness isn’t limited to just short-term trading.
ADX at 40.76 Confirms Mature Downtrend Nearing Exhaustion Point
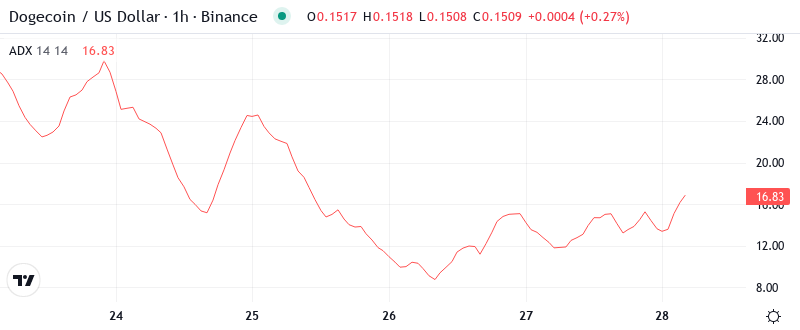
When you look at trend strength, the ADX reading of 40.76 tells us that we are well into a directional move – specifically a very powerful downtrend that has been building since December. When ADX gets above 40, it’s saying that the current trend has reached a mature phase and exhaustion is increasingly likely, but it is very treacherous trying to time the exact bottom.
In the past, DOGE’s ADX readings above 40 have indicated strong trend termination points – either to the upside or downside. So in terms of being a contrarian, you should be ready for a trend reversal setup, but not until you see evidence such as a bullish divergence in momentum or a solid reclaim of the 20-day EMA at $0.158. The Swiss ETP launch for meme coins provides a fundamental catalyst that could coincide with this technical exhaustion signal.
Price Trapped Below Entire EMA Ribbon Since December Break
Looking at price patterns, DOGE illustrates a notorious head-and-shoulders top pattern (not visible on the USD chart) which suggests a potential selloff. The measured move (MM) for a head-and-shoulders range block break is MM=BreakoutVolume * %Change, and this can be determined visually in BullFlag’s volume profile. The May 2022 initial selloff in block 4 defined the range block broken shortly before the uptrend. Block 1’s MM comes in near 0.07 to 0.05; any further breakdown will target these lower levels.
The most important compression is between current price @ $0.1509 and the 200-day EMA just below @ $0.148 – a mere 2% cushion and the final technical defense for bulls with this level. Once it breaks, the next meaningful support doesn’t arrive until the August lows near $0.08, creating an air pocket risk of another 40% decline. The 50-day that provided support throughout the Q4 rally now aacts a resistance nearly 20% overhead.
Support Architecture Crumbles While Resistance Stacks Heavy Overhead
Below the current levels, the supports are looking more precarious by the day, with just two notable levels keeping the technical floodgates from opening. Support to the downside starts with the psychological $0.15 level, which also happens to be the 200-day EMA and an absolute must-hold if there’s to be any hope for the bulls. Below that is the August low of $0.098, which is the only other meaningful historical level before prices are back in price discovery to the downside.
There are several resistance levels that XRP/USD will have to overcome if it is to reverse this trend and begin pushing higher prices. The first resistance level coincides with the 20-day EMA of $0.158 and goes all the way up to the recent support breakdown at $0.183. After that, the monthly pivot at $0.1848, and the 50-day EMA at $0.177 will create a resistance cluster that would be very difficult to get through without a lot of trading volume, and potentially the positive ETF news that has been driving the prices higher for the last 10 days.
The market structure clearly shows a bearish bias – DOGE has put in a classic head-and-shoulders pattern and the measured move target takes it close to $0.10. This lines up neatly with the August support level, meaning that the market is already pre-empting this downside move, ETF or no ETF.
Bulls Need Volume Surge Above $0.183 to Shift Momentum
For the bears to remain in control, they must defend the $0.183 level and the 20-day EMA. If the price rejects from this zone, traders should test the $0.169 support. A break below this level will likely result in a rapid decline to $0.157 with the potential to reach $0.12 if the broader market experiences increased selling pressure.
If DOGE continues to consolidate above $0.15 despite a wick below, a long squeeze may be in play as breakout traders and emotional holders are shaken out from both sides. Such a fakeout on decreasing volume often tricks retail traders into the wrong side before the price quickly reverses to squeeze the early short entries providing liquidity for the more influential whales.
With a mature downtrend exhaustion signal from ADX and oversold momentum conditions, the most likely short-term outcome is a relief bounce attempt back towards $0.165-0.170 resistance before sellers return. Nonetheless, in the absence of verifiable positive developments with regard to an ETF or an overall recovery in the cryptocurrency universe, DOGE remains exposed to another test of August support into early September.