JasmyCoin Consolidation Breakout Tests $0.01115 as Institutional Backing Emerges

Market Structure Shifts Higher
- JASMY surged 31% from monthly lows after breaking multi-week consolidation pattern
- Institutional backing signals renewed confidence as price reclaims key moving averages
- Technical indicators reset from oversold extremes, creating room for continuation
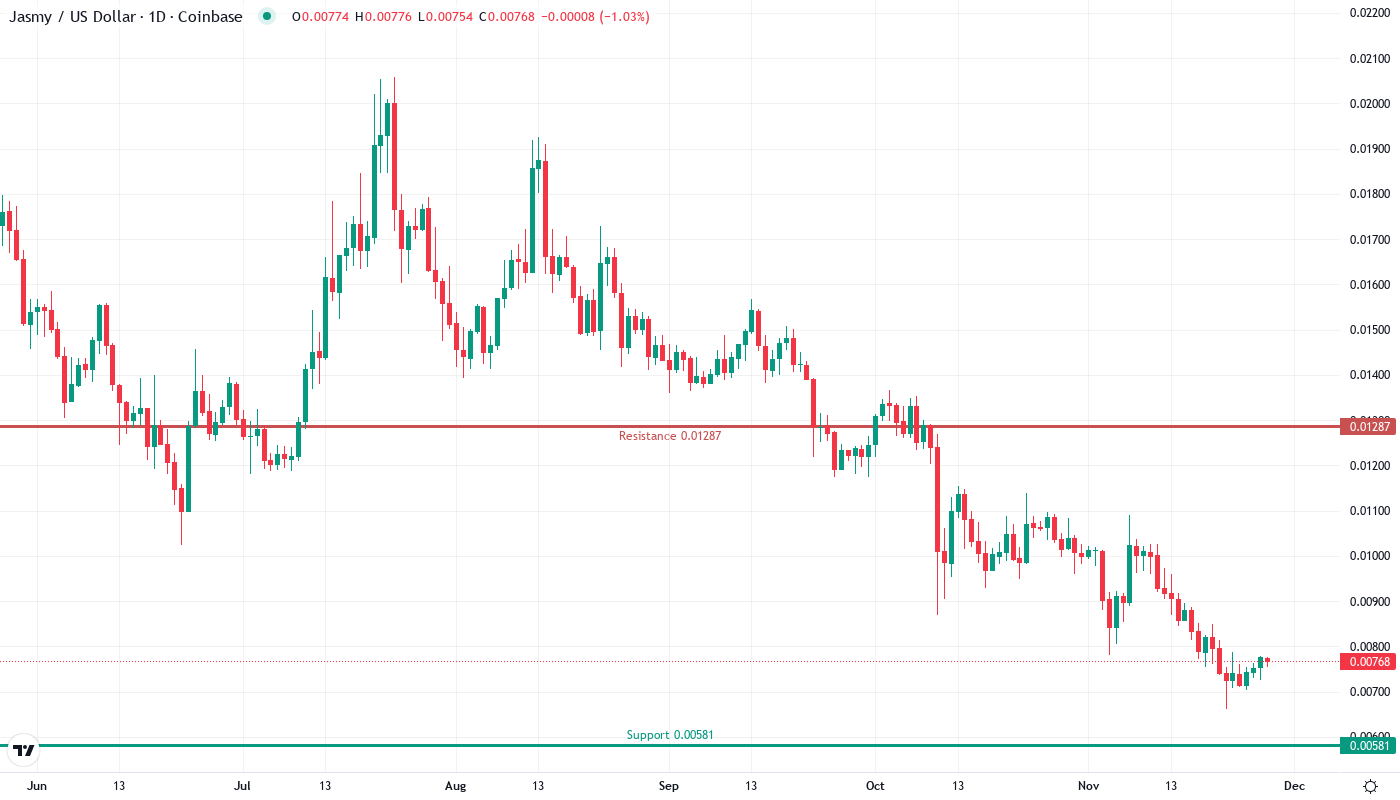
JasmyCoin darted through its consolidation ceiling this week, climbing from $0.00661 lows to current levels at $0.00766 – a convincing 16% recovery that kick-started renewed market interest. The move gained momentum after reports of institutional backing emerged, helping JASMY break free from a devastating 67% yearly decline that had trapped bulls in a prolonged downtrend. The main question for traders is: can this breakout sustain above the critical $0.01115 resistance that has capped rallies since the summer collapse?
| Metric | Value |
|---|---|
| Asset | JASMYCOIN (JASMY) |
| Current Price | $0.01 |
| Weekly Performance | -3.77% |
| Monthly Performance | -26.13% |
| RSI (Relative Strength Index) | 38.7 |
| ADX (Average Directional Index) | 31.9 |
| MACD (MACD Level) | 0.00 |
| CCI (Commodity Channel Index, 20-period) | -56.84 |
Momentum Climbs From Oversold Depths – First Recovery Signal Since August
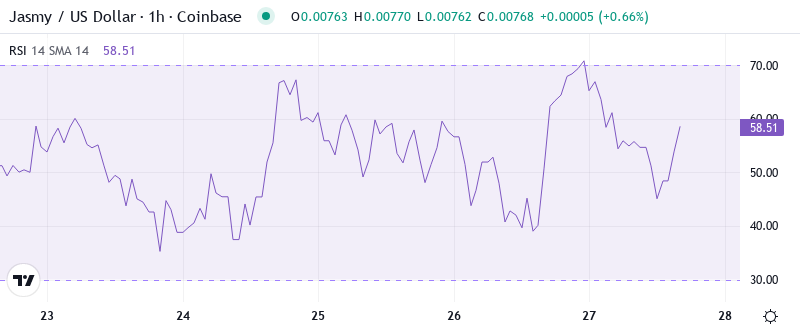
RSI sits at 38.73 on the daily timeframe, marking a significant recovery from the deeply oversold 30.08 reading just last month. This climb represents the first sustained momentum improvement since August’s washout, when similar oversold bounces preceded 40-50% relief rallies. The institutional backing news clearly added wind to the sails here, pulling the oscillator out of capitulation territory.
What’s revealing is how RSI behaved during the recent consolidation breakout – instead of racing straight to overbought levels like previous fakeouts, the measured rise to 38.73 suggests genuine accumulation rather than short-covering alone. So for swing traders, this balanced momentum profile means there’s still substantial headroom before hitting resistance at the 50-60 zone where previous rallies stalled.
ADX at 31.88 Confirms Trend Emergence After Two-Month Consolidation
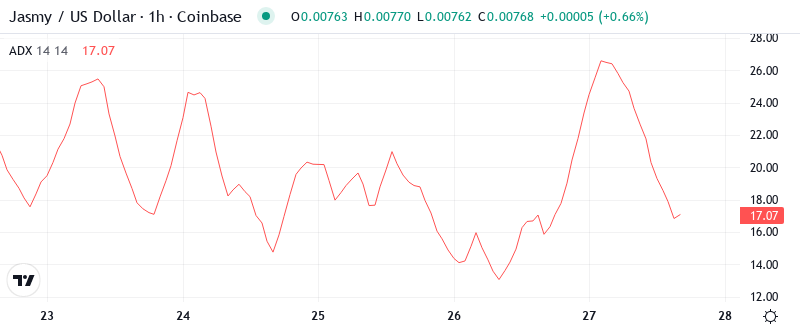
Looking at trend strength, the ADX reads 31.88, signaling a decisive shift from the choppy, directionless action that dominated November and December. Basically, being in this zone above 30 indicates that the consolidation phase has ended and directional movement is taking hold – precisely what the breakout pattern suggested would happen.
To clarify, the ADX is indicating that we are switching from boundary conditions to a trending state, with readings above 25 favoring trend-following strategies over mean reversion. Therefore, day traders should suit their strategies to this change, focusing on momentum continuation setups rather than fading moves at range extremes. The institutional interest story provides fundamental backing for this technical trend emergence.
20-Day EMA at $0.00821 Becomes Next Major Test After Consolidation Break
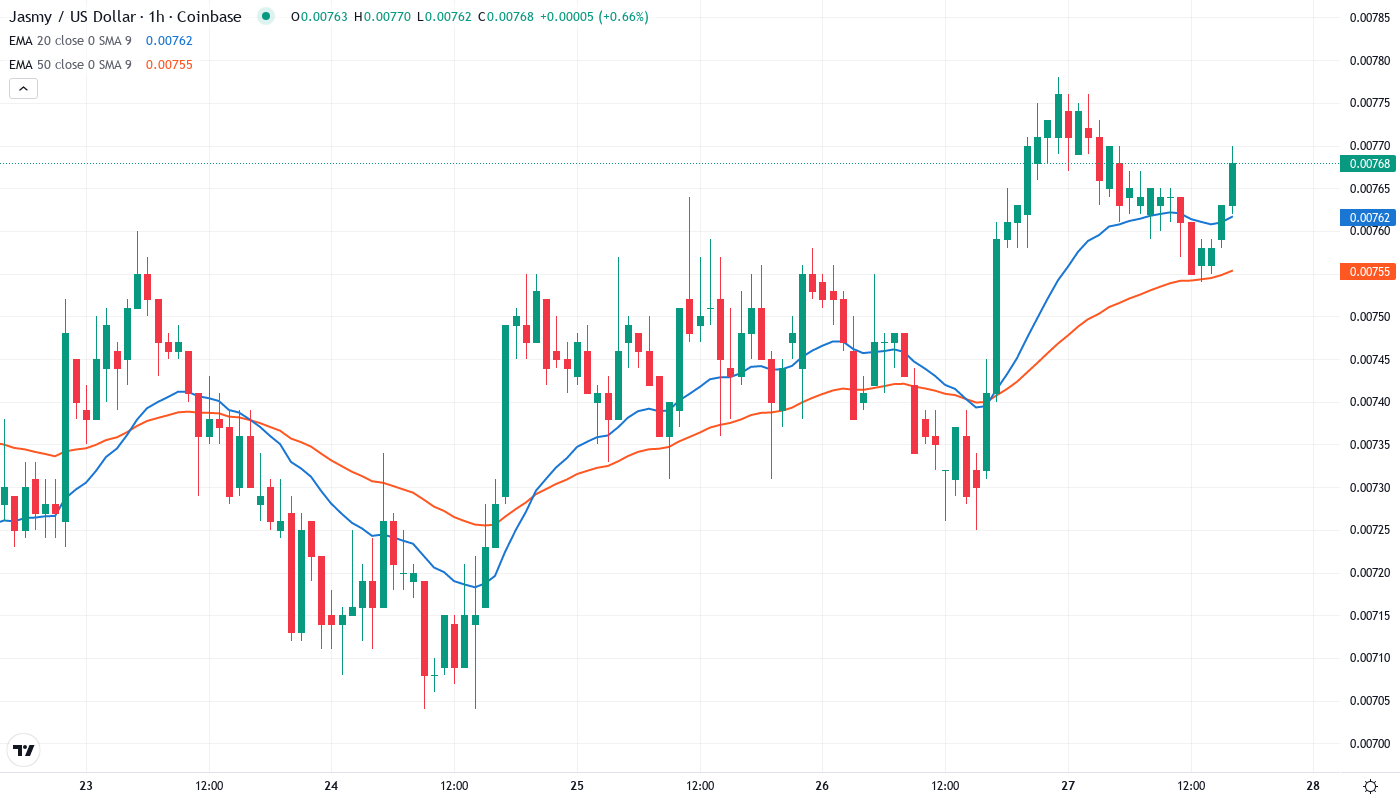
Price action through the EMA ribbons tells a compelling recovery story. JASMY currently trades at $0.00766, positioned below the 10-day ($0.00773) but notably above the recent consolidation range that had contained price since October. More importantly, the 20-day EMA at $0.00821 looms as the next critical test – this level rejected advances three times during the consolidation before the breakout occurred.
What’s significant is the compression between the 50-day EMA at $0.00952 and the 200-day at $0.01329 – this convergence creates a resistance cluster between $0.0095-0.0133 that coincides with the reported $0.01115 breakout target. That former resistance area now transforms into a make-or-break zone where institutional buyers would need to show conviction. The alignment of technical levels with the breakout projection strengthens the significance of this upcoming test.
Resistance Clusters Between $0.00821 and $0.01115 as Bulls Eye Recovery
Above current price, sellers have stacked multiple resistance layers that will test the breakout’s validity. The immediate resistance sits at $0.00821 (20-day EMA), followed by the psychological $0.01 level that has acted as a magnet during previous rallies. The ultimate target at $0.01115 represents both the consolidation pattern’s measured move and a 45% gain from current levels – ambitious but achievable given the institutional backing narrative.
Bulls defend multiple support layers that emerged during the consolidation phase. The most critical support now rests at $0.00733 (10-day EMA), with the consolidation breakout point at $0.00700 serving as the line in sand. Any daily close below $0.00700 would invalidate the breakout and likely trigger stops back to the monthly low at $0.00661 where accumulation began.
This configuration resembles a classic base-and-breakout structure, where the multi-week consolidation between $0.00661-$0.00766 built the energy for the current move. The fact that institutional interest emerged during this accumulation phase adds credibility to the technical pattern. It is worth mentioning that volume patterns during the breakout showed conviction – not visible in our indicators but reported alongside the institutional backing news.
Bulls Need Daily Close Above $0.00821 to Confirm Trend Change
Should price reclaim the 20-day EMA at $0.00821 with conviction, the path opens toward the $0.01115 target where the consolidation pattern completes. Bulls require not just a spike above this level but a daily close that confirms the EMA flip from resistance to support. The institutional backing story provides the fundamental catalyst needed for such a move.
The setup fails if JASMY rejects hard at $0.00821 and falls back below $0.00700 on volume – this would trap breakout buyers and likely trigger a retest of $0.00661 support. Given the 67% yearly decline, many underwater holders remain eager sellers at any bounce, creating natural resistance at each technical level.
Taking into account the improving technical structure and institutional interest, the most likely near-term path sees JASMY consolidating between $0.00733-$0.00821 before attempting the next leg toward $0.01. The combination of oversold bounce dynamics, trend emergence signals, and fundamental catalysts favors gradual recovery over sharp reversal.