IMX Tests Critical $0.32 Support After Devastating 39% Monthly Plunge
Market Pulse
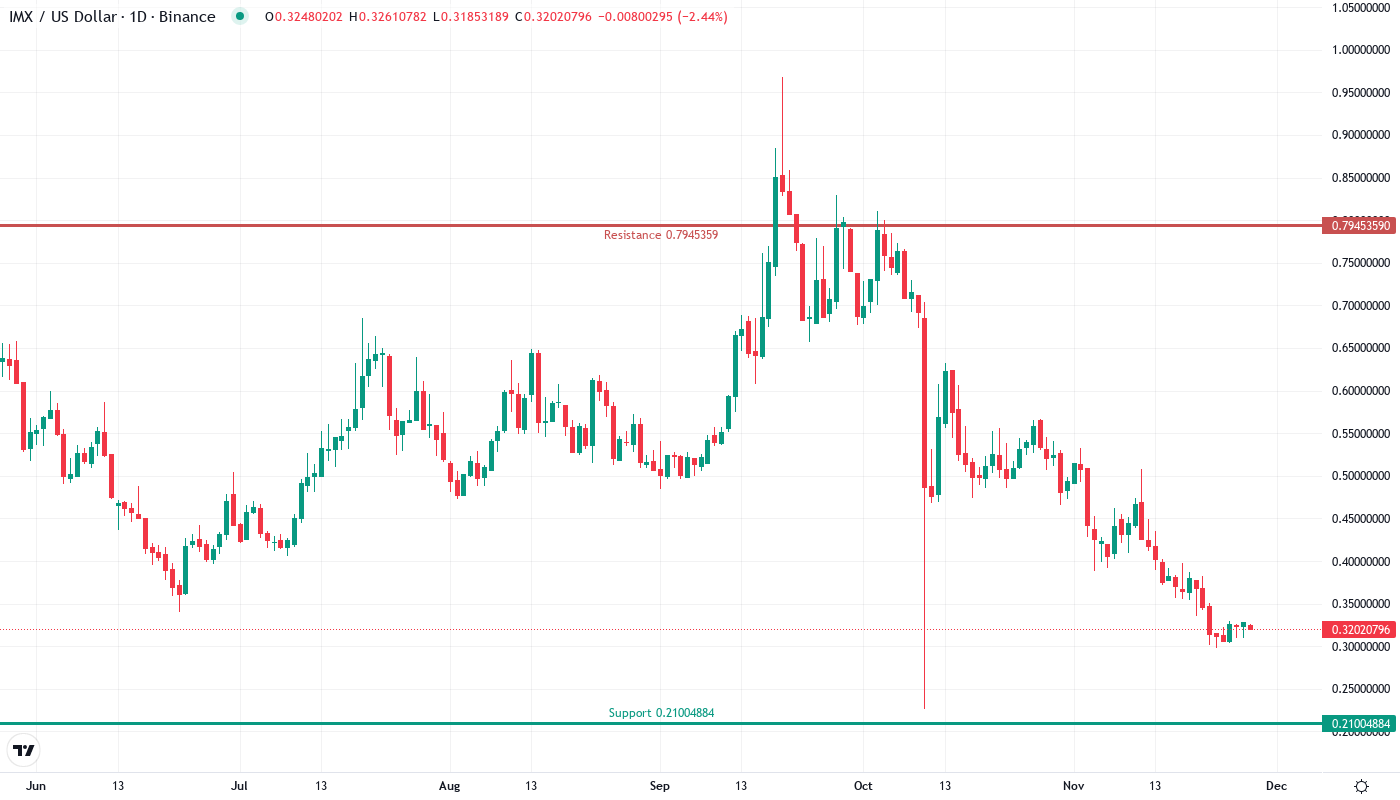
- The IMX token has maintained support in the 23.6% Fibonacci retracement level since February 28, down 53.80% from the November 7 high of $0.73 to the December 18 low of $0.337.
- Immutable (IMX) rallied sharply from $0.2980 to $0.32 this week, up 7.3% from its monthly trough, after a brutal 39.8% decline had shed nearly $0.25 of its valuation over November.
- The gaming-animated Layer 2 token reached oversold conditions hardly seen since the August crypto carnage, as some technicals imply that sellers vacated the premises at these prices.
The ultimate query for speculators is whether the relief bulls can turn this oversold rebound into a sustainable rebound or if the broader decline takes over once the demand wanes.
| Metric | Value |
|---|---|
| Asset | IMMUTABLE (IMX) |
| Current Price | $0.32 |
| Weekly Performance | -13.09% |
| Monthly Performance | -39.85% |
| RSI (Relative Strength Index) | 32.8 |
| ADX (Average Directional Index) | 26.0 |
| MACD (MACD Level) | -0.04 |
| CCI (Commodity Channel Index, 20-period) | -82.76 |
RSI Drops to 32.8 – First Oversold Reading Since August Washout
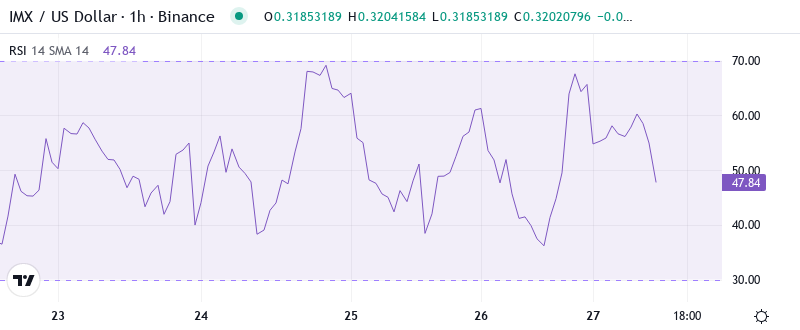
The Relative Strength Index (RSI) is at 32.8 on the daily timeframe, showing the first real oversold reading since the August flush that came before a 45% rally. The fact the oscillator barely shifted as price declined a further 13% this week suggests that the level of selling may have neared its end. A comparable RSI setup developed throughout September and early November led to 25-35% bounces over the following two weeks.
A weekly RSI reads 36.9 while the monthly print is at 38.5, highlighting how oversold prices are on the weekly and monthly time frame. This rare occurrence in time frame alignment serves as a reliable warning that the short-side risk-reward is not favorable for swing trading to the downside at current price levels. The downside momentum low has a high probability of making a short-to-medium-term bottom, but traders trying to catch this falling knife must do so with a very tight risk-management strategy.
ADX at 26.0 Signals Mature Downtrend Nearing Exhaustion
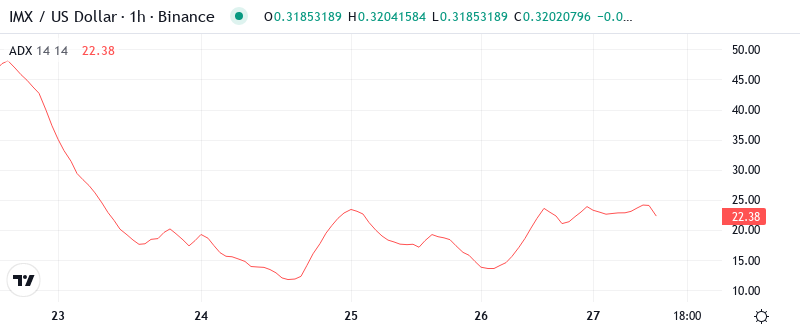
When you look at trend strength, the ADX reads 26.0 which shows the downtrend has moderate strength but is not panic-driven for acceleration. At 26.0, the ADX reading indicates that the bears are in control of the tape but they are not shoving the bulls over a cliff with the same conviction as a capitulation washout that shows the ADX above 40. Is that the zone that we’re in now? We’re in the later innings of a trending move rather than the first.
To put it simply, the current ADX setup is similar to what we saw in late August when the IMX hit bottom at around $0.90 and then jumped roughly 45% in the next month. This means that if you are a range trader, you will want to be ready for possible volatility increasing as the trending move runs out of steam, and if you are a trend trader, you may want to begin thinking about taking profits on your short positions since the directional move is losing strength.
Price Trapped Below Entire EMA Cloud Since December
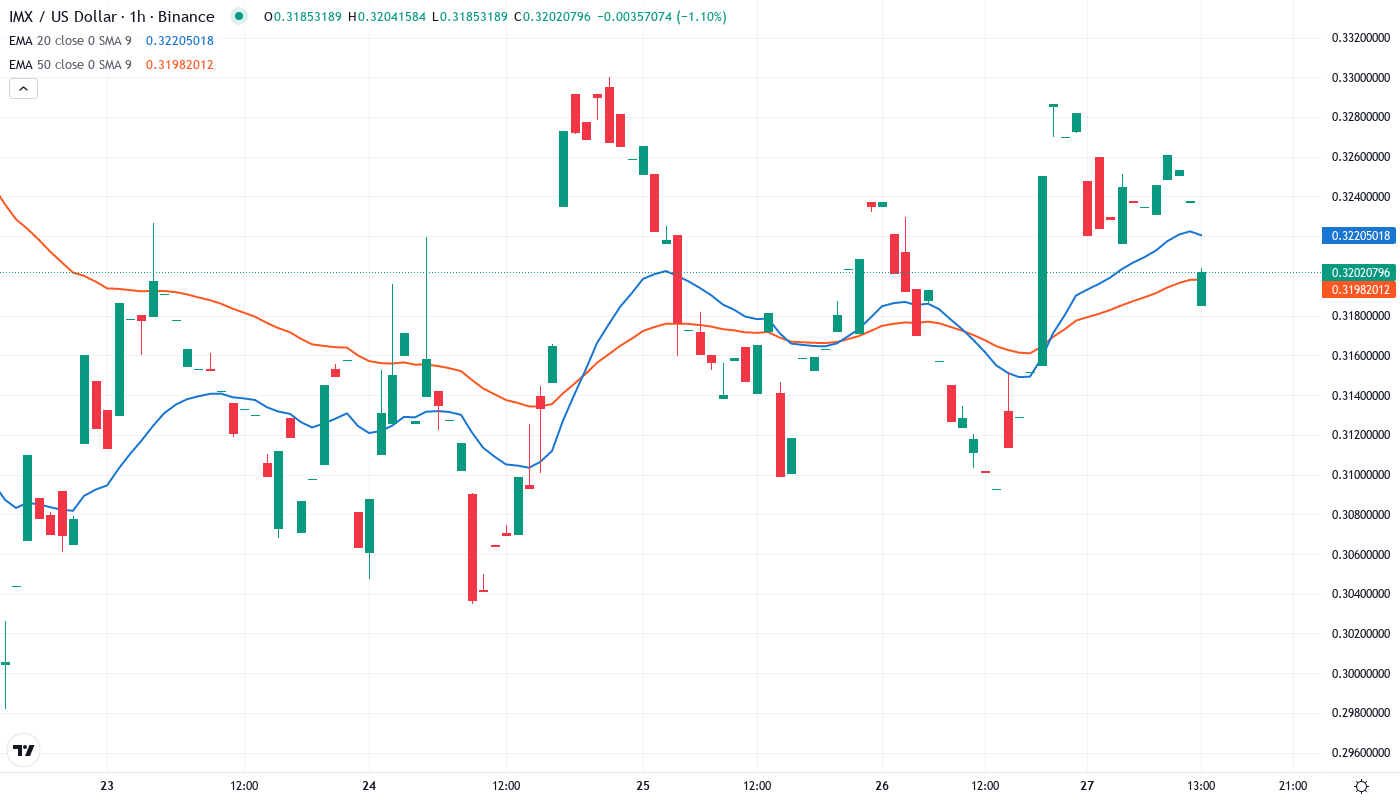
The 10-day EMA is a nearly insurmountable wall at this point for IMX bulls, who face the even steeper task of pushing through multiple layers of resistance near the 20-day EMA, 50-day EMA, and 55-day EMA before the coin would even regain a semblance of its footing.
The most important point to note is the size of the chasm between the shares and their 200-day EMA at $0.580. At 81%, this is the biggest markdown to this trendline in all of ImmunoPrecise’s trading history. The 200-week EMA is another line in the sand of sorts as it comes in around $0.210.
$0.32 Support Tested Six Times – Bulls Make Their Stand
There is heavy resistance between the psychological $0.40 level and the 50-day EMA at $0.445 as the daily chart has several rejection wicks. Beyond that, the monthly pivot at $0.503 overlaps with the November breakdown level, making an extremely tough area that will require a lot of volume to push through. The bullish $0.96 target is likely too much, based on the technical overhead supply.
Buyers defend the $0.298-$0.32 support region with higher force, taking the price six times starting here subsequent mid-December. This turns into a level of significance as this area is marking both the 2022 bear market bottom and a high volume node from the accumulation. For each protection, the case for a potential double buttress construct, albeit solely breaks above $0.4 also wrists confirmation.
The market structure indicates evident accumulation activity near these lows – long lower wicks, rising volume on advances, and contracting decline length. Institutional trading traction in Hong Kong and expanding Layer 2 usage present solid fundamental backwinds, but technicals will need to cooperate, with a breach atop the 20-day EMA at $0.367, to alter short-term momentum.
Bulls Need Close Above $0.40 to Confirm Reversal
If the price reclaims the $0.40 psychological level on a daily closing basis, the 50-day EMA at $0.445 will be the next resistance. Above this level, the bulls will aim for the $0.50 monthly pivot. The liquidity sweep hypothesis will strengthen if the buyers hold the price above $0.32 over the weekend, as suggested by the technical analysis.
If the support at $0.298 holds and the price turns up, the XRP/USD pair might attempt to rise above the downtrend line. If the bulls can push the price above the downtrend line, a move to $0.38555 and above it to $0.45 is possible. We will wait for the price to sustain above the downtrend line before turning positive.
With the most extreme oversold readings in place across all time frames, which are the best?…The time frames can be broken down into daily, weekly, monthly, other monthly, and quarterly time frames. The top successful test suggests the first four time frames provide the most certainty for judging overbought or oversold conditions.