Optimism Tumbles 27% as Network Upgrades Trigger Exchange Suspensions

Market Structure Shifts Lower
- OP plunges to $0.332, shedding 27% in monthly timeframe amid exchange disruptions
- Technical indicators align bearishly with RSI at 38.9 and ADX climbing past 38.5
- Support at $0.286 becomes critical as network upgrade uncertainties weigh on sentiment
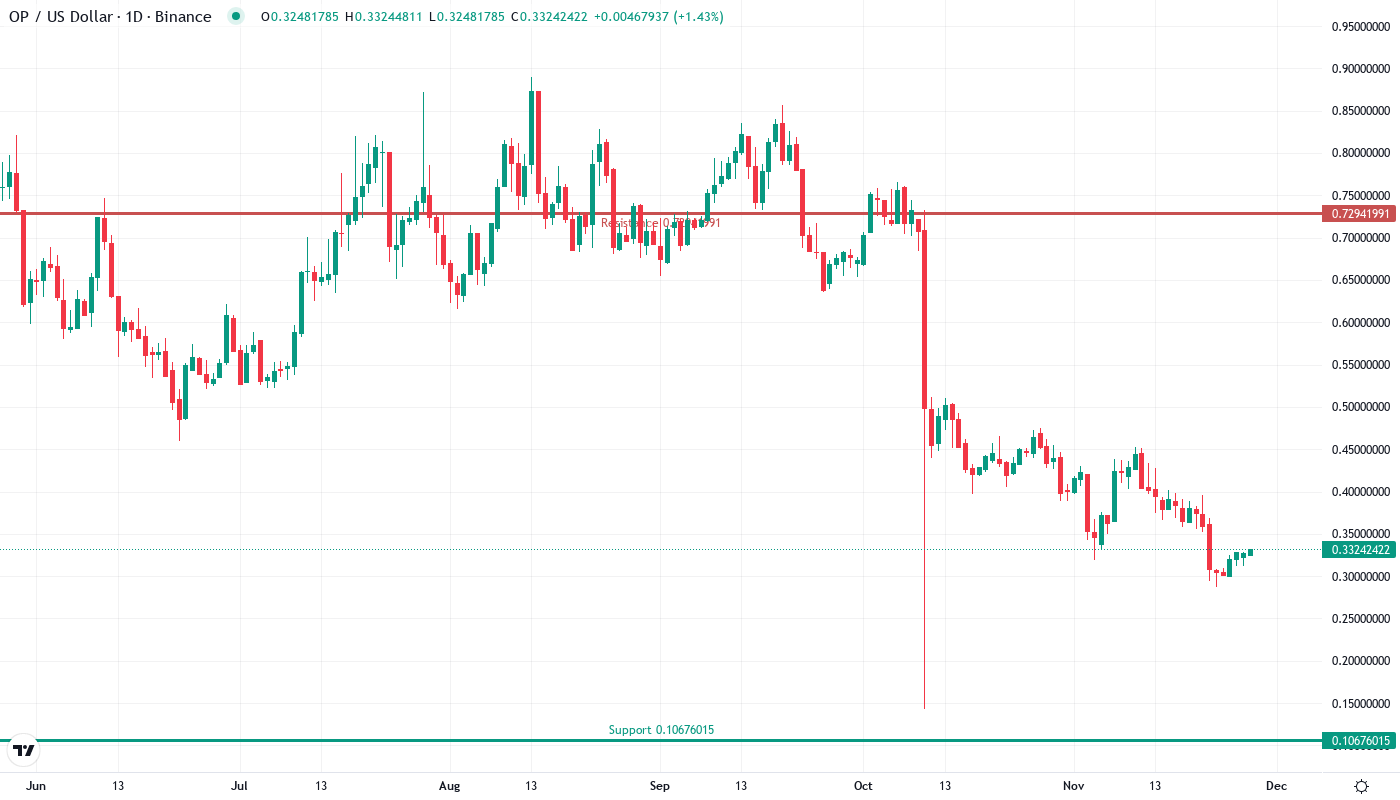
Optimism’s price action tells a story of technical breakdown meeting fundamental headwinds. The Layer 2 scaling solution has tumbled from its monthly high of $0.456 to current levels near $0.332, representing a devastating 27% decline that accelerated after major exchanges suspended OP services for network upgrades. This sharp correction extends the token’s 3-month slide to 55%, with selling pressure intensifying as both Binance and Upbit halted deposits and withdrawals during the critical hard fork implementation. The main question for traders is: will the multi-tested support at $0.286 hold through this period of operational uncertainty, or are we witnessing the start of a deeper flush?
| Metric | Value |
|---|---|
| Asset | OPTIMISM (OP) |
| Current Price | $0.33 |
| Weekly Performance | -11.08% |
| Monthly Performance | -26.86% |
| RSI (Relative Strength Index) | 38.9 |
| ADX (Average Directional Index) | 38.6 |
| MACD (MACD Level) | -0.03 |
| CCI (Commodity Channel Index, 20-period) | -71.47 |
RSI Approaches Oversold Territory After Sharp Capitulation
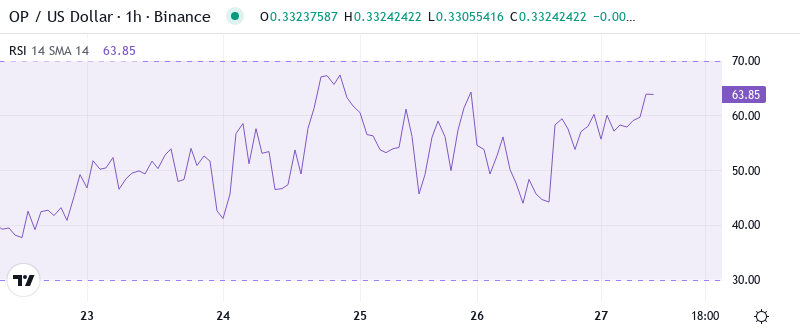
Reading the oscillator at 38.9 on the daily timeframe, traders see momentum approaching levels that historically marked significant bottoms for OP. The rapid descent from neutral territory above 50 just weeks ago signals genuine capitulation, particularly as exchange suspensions created an air pocket of liquidity that accelerated the decline. What’s interesting is that similar RSI readings in previous cycles – specifically when the indicator dipped below 40 – often preceded sharp relief bounces of 15-25%.
For swing traders hunting oversold bounces, this RSI configuration suggests we’re entering the zone where counter-trend rallies typically emerge. However, the network upgrade overhang means any bounce could face immediate selling from traders who couldn’t exit during the exchange suspensions. It is worth mentioning that the weekly RSI at 34.1 confirms the oversold condition across multiple timeframes, adding weight to the potential reversal setup.
ADX Spike to 38.6 Confirms Trending Conditions Favor Bears
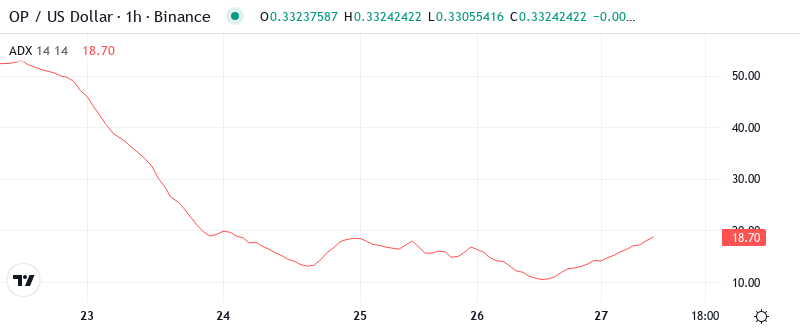
Trend strength has exploded higher with ADX climbing to 38.6, marking the shift from December’s choppy consolidation to a decisive directional move. Basically, when ADX pushes above 35 like this, it signals that the prevailing trend – currently bearish – has genuine momentum behind it rather than just temporary selling. The surge in trend strength coincided precisely with the exchange suspension announcements, as uncertainty around the hard fork triggered stop-loss cascades below key support levels.
Day traders should adapt their strategies to this trending environment by favoring short entries on rallies rather than trying to catch falling knives. The combination of high ADX and bearish price structure suggests that rebounds will likely be sold into until this indicator starts rolling over from extreme levels. Crucially, the last time OP’s ADX reached similar heights above 38, the subsequent trend exhaustion led to a multi-week consolidation phase.
20-Day EMA at $0.358 Becomes First Resistance After Support Failure
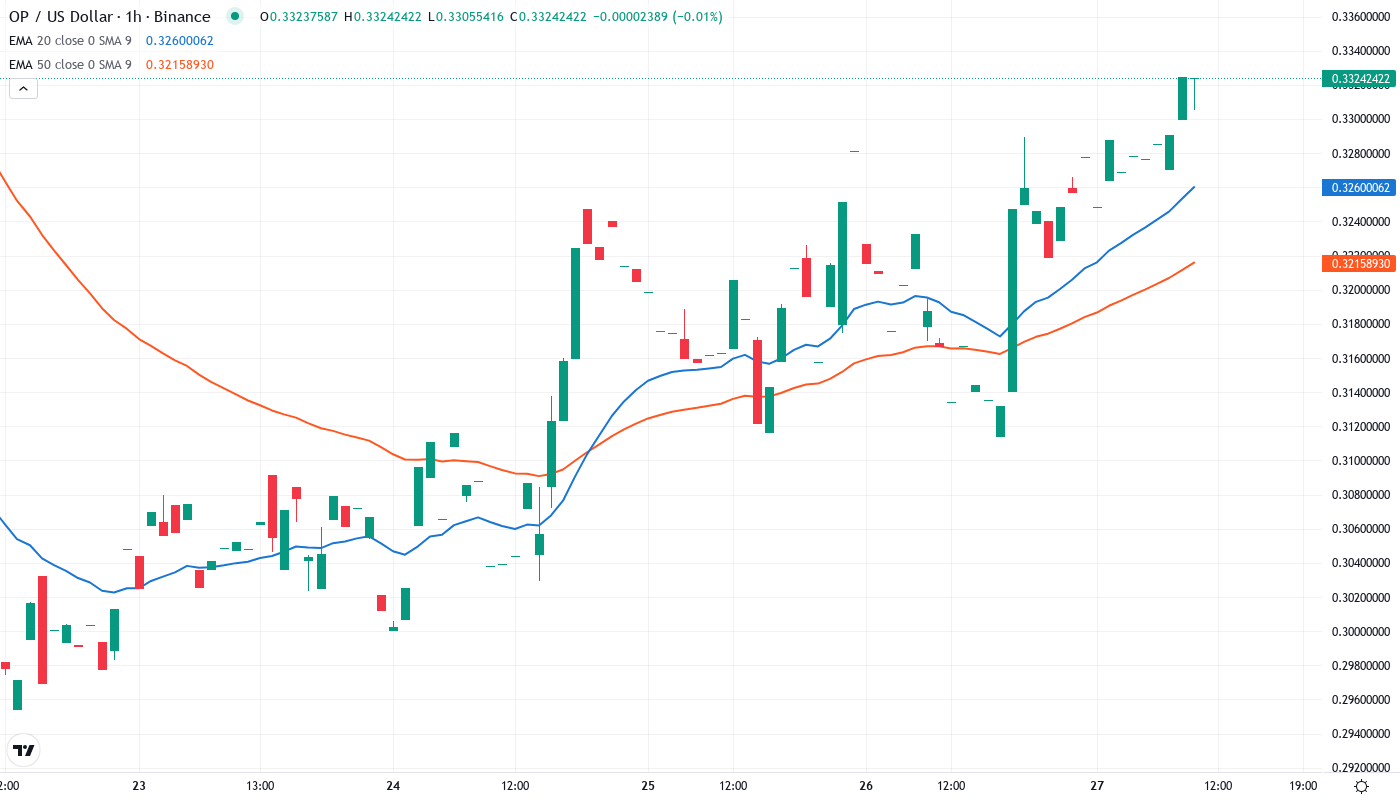
Price action through the EMA ribbons paints a clear picture of deteriorating structure. OP currently trades below all major moving averages, with the 10-day ($0.336) providing immediate overhead resistance just pennies above current price. More significantly, the 20-day EMA at $0.358 – which had supported price through most of December – flipped to resistance after the network upgrade news catalyzed the breakdown. The 50-day EMA sits considerably higher at $0.430, representing a 30% premium to current levels.
This complete bearish alignment of moving averages creates a stacked resistance zone that bulls must reclaim to shift the technical picture. The failed attempts to hold above the 20-day EMA during the initial exchange suspension announcements marked the point where trapped longs began liquidating positions. Therefore, any sustainable recovery requires a decisive close back above $0.358 to neutralize the bearish MA structure, though such a move appears unlikely while network uncertainty persists.
Support at $0.286 Tested Multiple Times Since Q3 Becomes Make-or-Break Level
Below current price, the critical support zone spans from $0.286 to $0.308, representing the monthly low and a level that has been tested six times since September. This area gains additional significance as it aligns with the 0.786 Fibonacci retracement of the entire 2023 rally, making it a natural target for the current selloff. Volume profiles show significant accumulation occurred in this zone during previous tests, suggesting institutional players may defend it again.
Resistance stacks heavy between current levels and the psychological $0.40 mark, with the most immediate barrier at $0.337 (Monday’s pivot) followed by stronger resistance at $0.358 where the 20-day EMA converges with recent breakdown levels. The monthly pivot at $0.445 sits nearly 34% above current price, illustrating just how dramatically sentiment shifted once the hard fork complications emerged.
Market structure remains firmly bearish as long as price stays below $0.358, with each failed attempt to reclaim this level likely attracting fresh shorts. The compression between established support at $0.286 and nearby resistance at $0.337 resembles a coiled spring that should resolve directionally within days as the network upgrade situation clarifies.
Bears Target $0.286 Support Break as Network Uncertainty Lingers
Bulls require a sustained push above $0.358 to neutralize immediate bearish pressure and open the path toward $0.430 (50-day EMA). Such a move would need to coincide with successful completion of the network upgrade and resumption of normal exchange operations to sustain buying interest. The technical setup would turn constructive only with consecutive daily closes above the 20-day EMA.
The bearish scenario accelerates if $0.286 support fails on volume, which would trap recent buyers betting on oversold bounces and likely trigger liquidations toward $0.250 or lower. A rejection at current resistance near $0.337 followed by a break below the monthly low would confirm continuation of the dominant downtrend, potentially targeting levels not seen since early 2023.
Given the oversold RSI, extreme ADX reading, and proximity to multi-tested support, the most probable near-term path involves a relief bounce toward $0.358 that fails to sustain, followed by another test of $0.286 support. Until the Optimism network upgrades complete successfully and normal trading resumes across all major exchanges, technical bounces will likely attract sellers rather than signal genuine trend reversal.