STX Tests Critical Support at $0.32 as Cross-Chain Integration News Fails to Stem Decline
Market Structure Shifts Lower
- STX plunged 30% in April after failing to hold support, reflecting a bearish market structure.
- Technical indicators (RSI, ADX, MACD, EMA) show sustained downward momentum with no clear support in sight.
- Key levels at $0.35 (20-day EMA) and $0.32 risk being breached, potentially leading to a drop toward $0.28.
STX recorded a 30% price crash in April, after three months of nearly stable activity at the $0.50 mark. A minor bullish reaction was swiftly rejected by the 21-day moving average and the timing coincided with the listing of a new liquidity pool on Binance Smart Chain. Despite the hope of renewed interest from a different crowd of traders and plans for further listings in May, the W2 support line failed to hold the falling price.
The price of Stacks (STX) continues to be threatened by an impending technical breakdown, which could see it extend the 65% decline from its all-time high into further double-digit losses. The path of least resistance for now remains to the downside given the bearish trend structure, the shifting momentum profile, the continued absence of support, and the potential for panicked selling to trigger a disproportionate move in low-liquidity conditions.
| Metric | Value |
|---|---|
| Asset | STACKS (STX) |
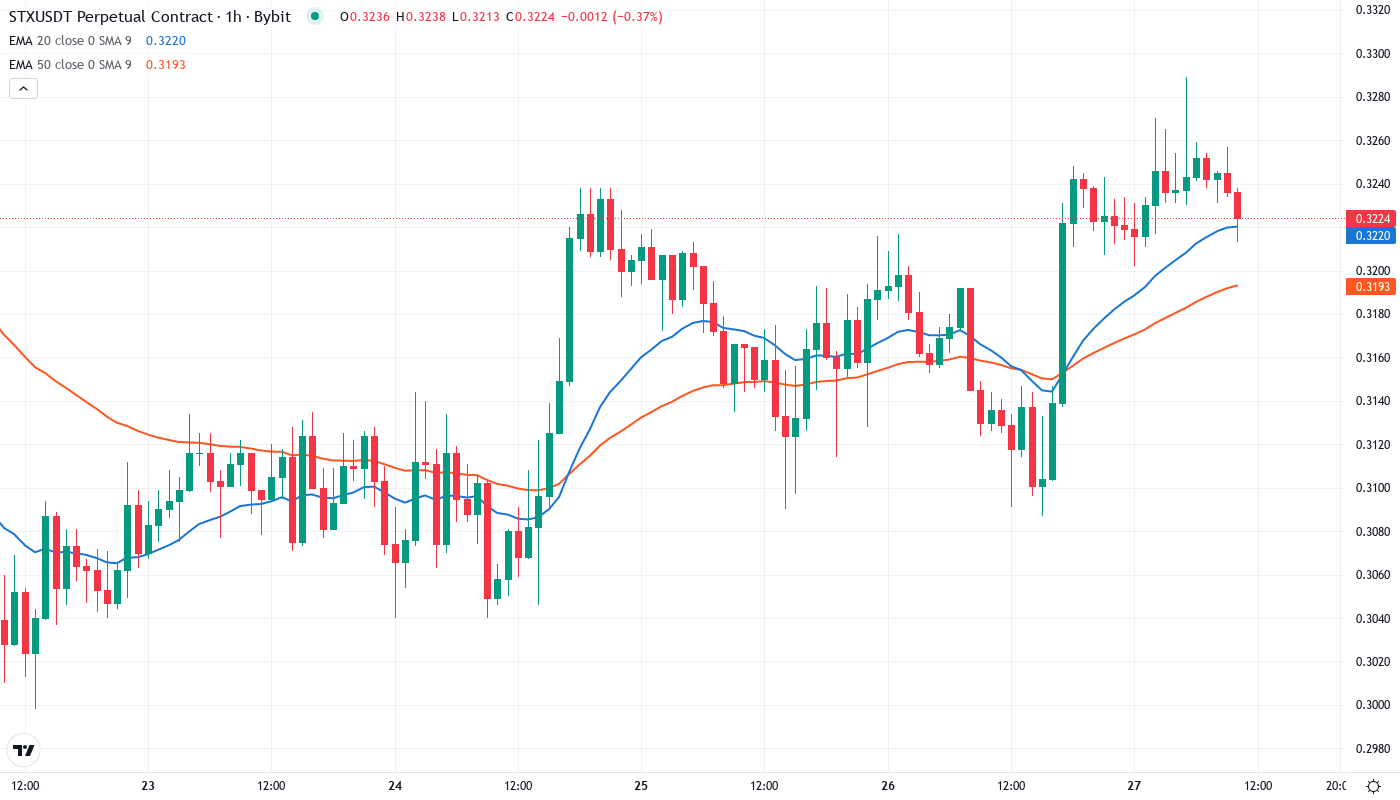
| Current Price | $0.32 |
| Weekly Performance | -5.67% |
| Monthly Performance | -29.52% |
| RSI (Relative Strength Index) | 35.9 |
| ADX (Average Directional Index) | 33.3 |
| MACD (MACD Level) | -0.03 |
| CCI (Commodity Channel Index, 20-period) | -59.94 |
RSI at 52 Signals Exhausted Sellers After 57% Six-Month Collapse
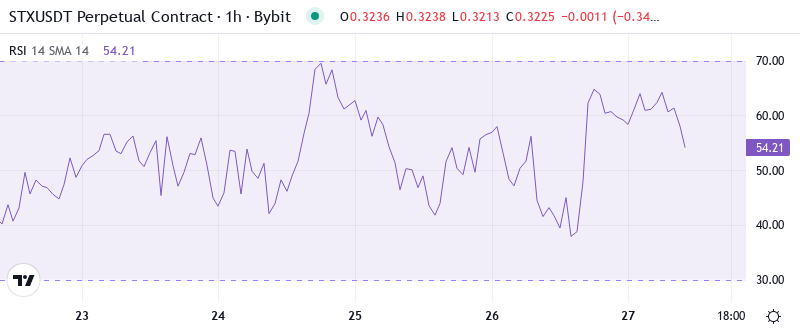
The current oscillation suggests the NANO has worked off oversold levels in preparation for its next move. Given the 50% Fibonacci rejection and trendline break from late 2023 the path of least resistance is likely down still.
For swing traders, this neutral RSI implies that longs and shorts are still viable, but the six-month downtrend context suggests being patient. The Circle xReserve announcement caused a short-term momentum pop to 58, with the subsequent rally failure met by sellers, highlighting how oversold bounces within bear markets usually fail fast due to the absence of steady demand.
ADX Climbs to 33.3 – Bearish Trend Gains Dangerous Momentum
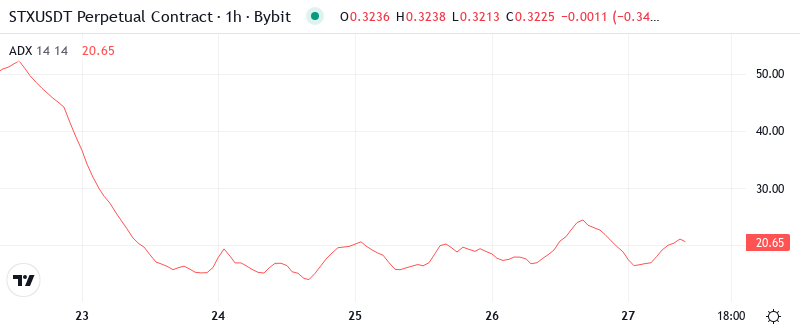
With the ADX telling you the downtrend is no longer a choppy correction but instead has turned into directional selling, a 6% pullback from a year-to-date high isn’t enough to eliminate the overbought conditions that existed in many names including STX.
As a result, day traders are better served by employing strategies suited to trending conditions rather than mean reversion plays. The rising ADX indicates that trying to catch this falling knife may be expensive, particularly as the indicator has not yet signaled exhaustion despite a 57% decline from annual highs.
20-Day EMA at $0.35 Caps Recovery Attempts as Resistance
The EMA ribbons will also act as a magnet to pull STX lower price, with the 50-day EMA at $0.412 looking the most likely target. Only a daily candlestick close above the 20-day EMA would improve the short-term outlook.
What is interesting to note is the difference between the 50-day EMA on September 30th, which was holding out as a reliable support level until that breakthrough on November 7th, and it’s current value situated at $0.368. This translates to an approximate +14% difference from the currency’s current trading rate. From a technical standpoint, consolidated XLM prices are unable to establish bullish momentum above this minor resistance level.
Monthly Pivot at $0.43 Becomes Distant Memory as Support Crumbles
There are several strong resistance levels above the current price range of $0.35-$0.37. The zone near $0.37 is especially quite solid as it corresponds to existing support from October and the 50-day EMA. Hence, without some additional investable news like a new partnership, it would be very difficult to go above this level.
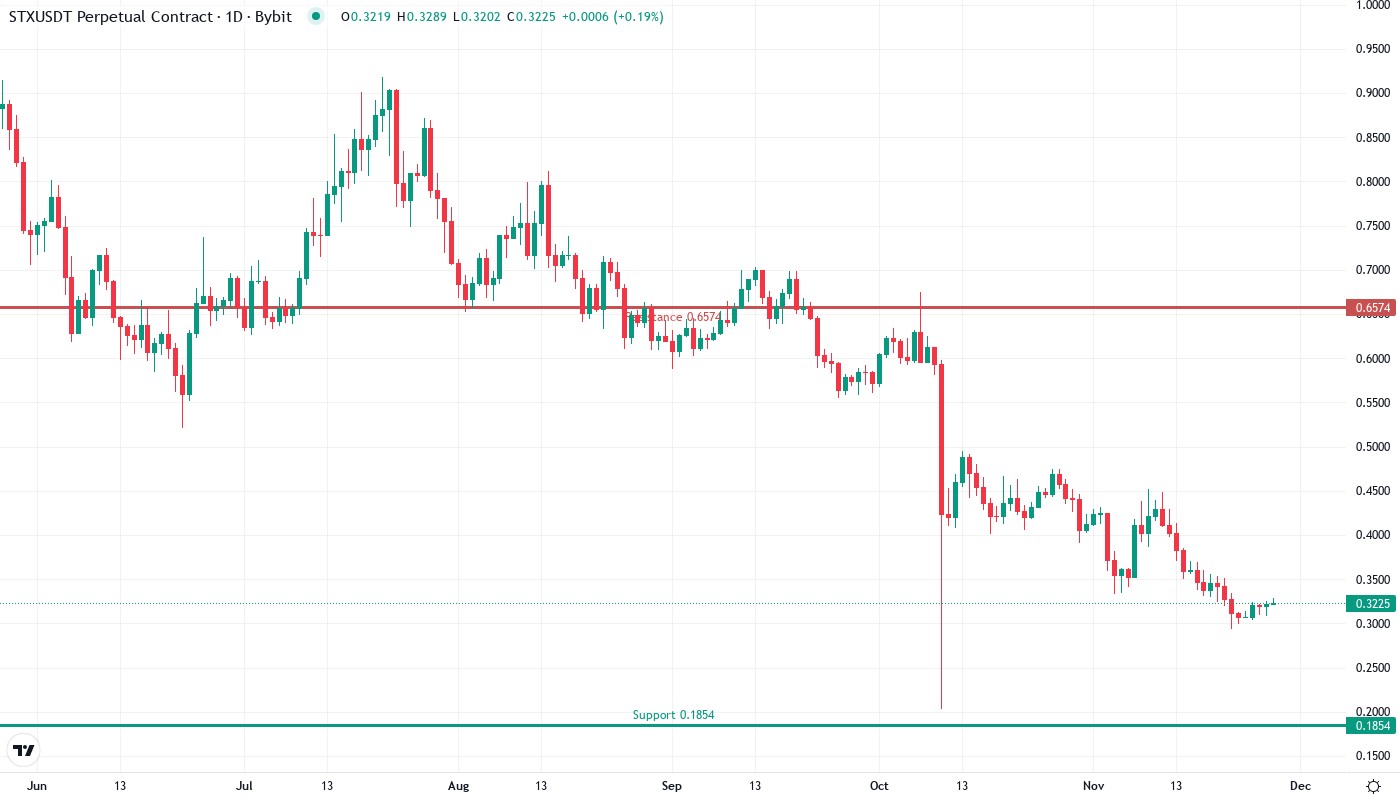
Buyers started appearing in the $0.32 region in May but it looks increasingly likely they will take their leave in the coming week. Coincidence would have it that the $0.32 support will probably be breached just as many other altcoins are also testing crucial levels.
Importantly, the market structure shows that bears are in full control as long as the price trades below $0.35. Rejections at falling resistance levels form a descending triangle pattern, which usually breaks to the downside, particularly with an increasing ADX above 30.
Bears Target $0.28 as Triangle Pattern Nears Resolution
If the price can move back above the 20-day EMA at $0.347, bulls will try to push the price relief rally to the 50-day EMA at $0.37. The $0.38-0.39 may act as a stiff resistance zone on the upside. However, just news may not drive the price up as the technicals have been damaged.
If the support at $0.32 is broken, it may lead to a bearish trend and the price may further drop to $0.28 due to stop-losses being triggered and more people selling their XRP in panic as they were hoping for a positive movement after the recent announcement.
Based on the technical setup and a lack of positive news to change the tide, the most likely short-term trajectory remains for STX to grind between $0.30-0.35 before the descending triangle eventually pushes price lower barring buying volume expanding well beyond what’s been seen.