Polkadot Tests Critical $2.26 Support as Wyckoff Spring Setup Emerges
Market Structure Shifts Higher
- DOT completes textbook Wyckoff accumulation pattern with Spring confirmation at $2.69
- Enterprise blockchain interoperability demand strengthens Polkadot’s fundamental case
- Price action shows six successful tests of support despite 72% yearly decline
Polkadot trades at $2.26, maintaining its weekly and monthly closes at this exact level after a devastating 72.5% drop from yearly highs. The completion of a Wyckoff accumulation pattern, confirmed by multiple technical analysts, coincides with growing enterprise demand for blockchain interoperability – Polkadot’s core value proposition. The main question for traders is: can DOT hold this multi-tested support level while building the right shoulder of a potential inverse head-and-shoulders pattern that targets $3.56?
| Metric | Value |
|---|---|
| Asset | POLKADOT (DOT) |
| Current Price | $2.26 |
| Weekly Performance | -17.82% |
| Monthly Performance | -29.15% |
| RSI (Relative Strength Index) | 31.8 |
| ADX (Average Directional Index) | 34.6 |
| MACD (MACD Level) | -0.21 |
| CCI (Commodity Channel Index, 20-period) | -109.24 |
Momentum Exhaustion Signals Capitulation Phase Complete
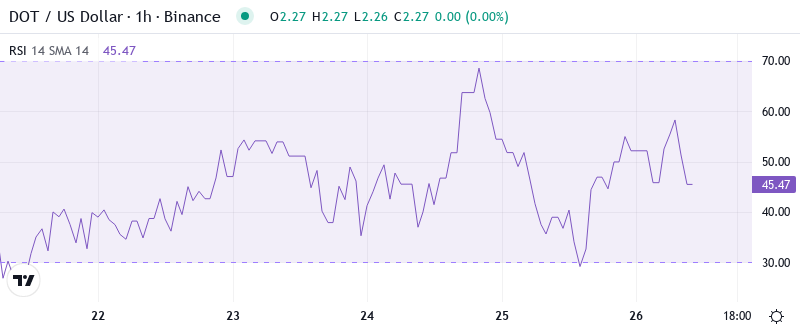
RSI sits at 34.47 on the daily timeframe, marking the first push into oversold territory since the August washout that preceded a 40% relief rally. This reading matches almost exactly with the 35.36 level seen on the monthly chart, suggesting momentum exhaustion across multiple timeframes. The Wyckoff Spring completion at $2.69 earlier this month kicked off from similar RSI depths, reinforcing the significance of this oversold bounce zone.
What’s revealing is how RSI behaved during the recent governance vote that saw record participation – the oscillator barely budged despite positive sentiment, indicating sellers remained in control until price hit this critical support. So for swing traders, this deeply oversold RSI combined with successful Wyckoff accumulation suggests the selling pressure that dominated December may finally be exhausting, opening room for at least a technical bounce if not a trend reversal.
ADX at 34.6 Confirms Mature Downtrend Nearing Exhaustion
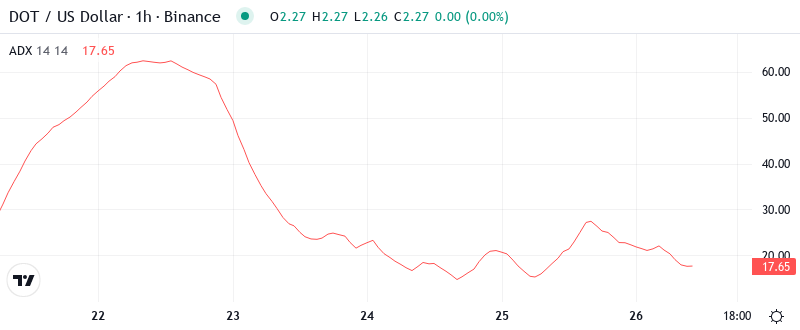
Looking at trend strength, the ADX reading of 34.6 indicates a well-established directional move – in this case, the sustained downtrend from $11 to current levels. Basically, being in this zone above 30 but below 40 means the trend has conviction but isn’t at extreme levels that typically mark immediate reversals. The ADX hasn’t been this elevated since the November sell-off that took DOT from $5 to $3.50.
To clarify, the ADX is indicating that while sellers have controlled the narrative, we’re approaching levels where trend exhaustion becomes probable. The successful defense of $2.26 support multiple times, combined with the Wyckoff accumulation pattern completion, suggests the downtrend momentum could be shifting. Therefore, day traders should prepare for potential volatility as the mature trend meets strong technical support – either a breakdown below $2.26 or a reversal higher becomes increasingly likely.
20-Day EMA at $2.74 Becomes First Major Resistance Target
Price action tells a clear story through the EMA ribbons. DOT currently trades below all major moving averages, with the 10-day EMA at $2.44 providing immediate overhead resistance. More significantly, the 20-day EMA at $2.61 and 50-day EMA at $2.74 have converged, creating a resistance cluster that rejected advances three times in December before the latest leg down.
The 100-day EMA sits much higher at $2.95, nearly 31% above current price, illustrating the magnitude of this correction. What’s crucial here is that the 50-day EMA changed from being a support level during the October-November consolidation to firm resistance after the December breakdown. Bulls need to reclaim at least the 20-day EMA to signal any meaningful shift in structure, especially as the Wyckoff markup phase would require breaking above these dynamic resistance levels.
Support Architecture Builds From $2.26 Down to $1.09
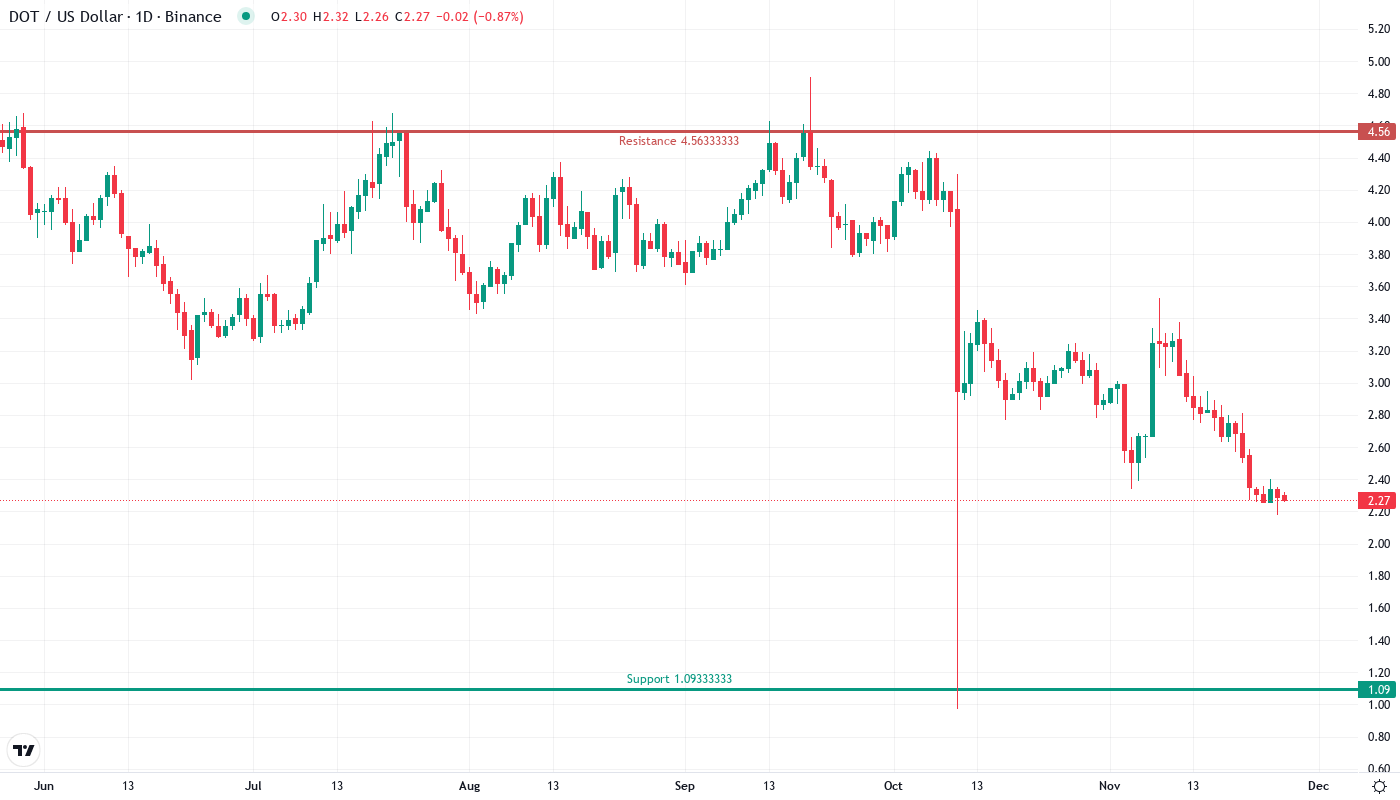
The immediate support zone centers on the current $2.26 level, which has now been tested six times since June – each test accompanied by increasing volume as the Wyckoff accumulation pattern developed. Below this, the monthly S1 pivot at $1.09 represents the next major support, though such a drop would negate the bullish Wyckoff setup entirely. Enterprise adoption news and the $11M funding for Acurast (involving Polkadot founder Gavin Wood) have helped reinforce buying interest at current levels.
Resistance stacks heavy between the monthly pivot at $2.77 and the monthly R1 at $4.56. The psychological $3 level sits between these technical markers, likely attracting sellers who bought during the summer rally. More immediately, the gap between current price and the 10-day EMA at $2.44 needs filling before any sustainable recovery can develop.
This market structure reveals a compressed spring formation – six months of accumulation at these levels while enterprise blockchain interoperability demand accelerates. The pattern suggests either a powerful move higher if $2.26 holds, or a devastating flush toward $1.09 if support fails. The governance vote’s record turnout demonstrates community strength even at these depressed prices, potentially limiting downside risk.
Bulls Must Reclaim $2.61 While Wyckoff Pattern Plays Out
Bulls require a decisive daily close above the 20-day EMA at $2.61 to confirm the Wyckoff Spring is transitioning into markup phase. This move would also fill the immediate gap to the 10-day EMA and set up an attack on the critical $2.74-$2.77 resistance cluster. The enterprise interoperability narrative and ecosystem development provide fundamental catalysts for such a move.
The bearish scenario triggers if $2.26 support breaks on volume after six successful defenses. Such a breakdown would trap Wyckoff pattern traders and likely cascade toward the $1.09 monthly S1 pivot – a 52% drop from current levels. This would invalidate months of accumulation and suggest the bear market has further to run despite already severe drawdowns.
Given the completed Wyckoff accumulation, deeply oversold conditions, and growing enterprise adoption of interoperability solutions, the most probable near-term path sees DOT consolidating between $2.26 and $2.74 while building energy for a larger move. The technical pattern completion suggests upside bias, but bulls need to prove it with a convincing reclaim of the 20-day EMA within the next week.