HYPE Plunges 29% as $316M Unstaking Precedes Major Token Unlock
Market Structure Shifts Lower
- The HYPE token price has dropped nearly 30% over the past month.
- $316M of HYPE was unstaked immediately before a large unlocking event, adding downward pressure.
- Technical indicators suggest a rebound, but the $29.39 support level remains untested.
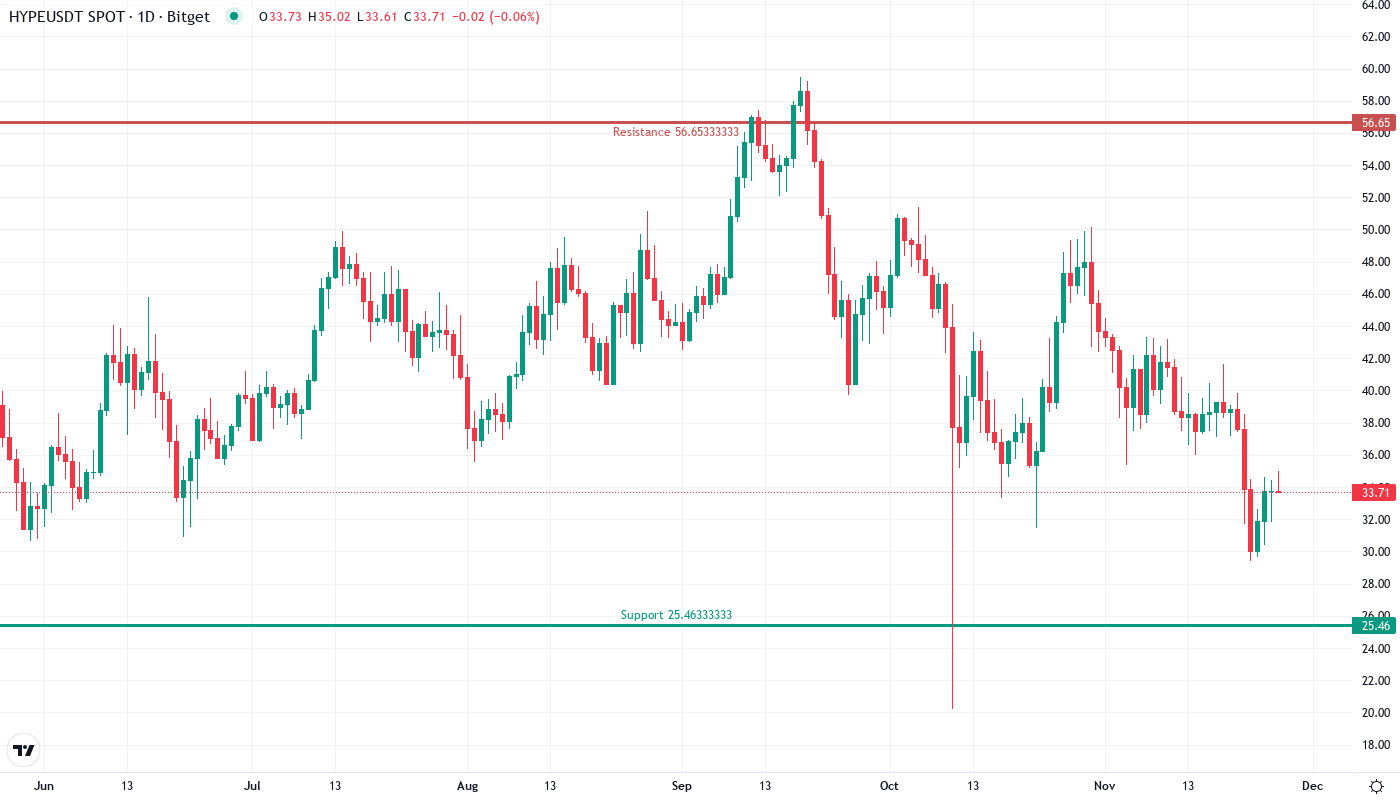
Over the past month, Hyperliquid’s HYPE token has taken a beating. The bulk of the tokens lending their liquidity to the decentralized protocol for uncollateralized loans were unstaked last week after an NFT loan deal went bad, spooking HYPE holders. Shares of collectible investment fund ETP Blue were used to collateralize the $316 million loan, resulting in the liquidation of HYPE shares locked in the deal. With tokens no longer at risk, sellers dumped their tokens into a thin secondary market. The sharp selloff pushed the token to a monthly low of $29.39, the worst print ever since it was launched in May 2024.
| Metric | Value |
|---|---|
| Asset | HYPERLIQUID (HYPE) |
| Current Price | $33.70 |
| Weekly Performance | -12.87% |
| Monthly Performance | -28.74% |
| RSI (Relative Strength Index) | 39.7 |
| ADX (Average Directional Index) | 24.7 |
| MACD (MACD Level) | -2.22 |
| CCI (Commodity Channel Index, 20-period) | -82.53 |
RSI Hits 39.67 – Deepest Oversold Reading Since Launch
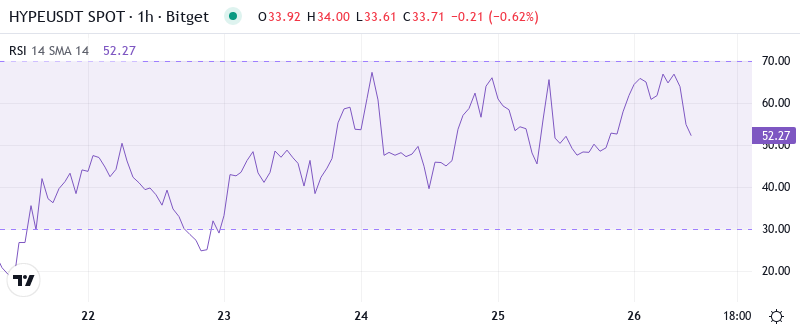
The latest RSI reading arrived at 39.67, which is the first occasion where HYPE has reached oversold levels since its inception. Typically, an oversold RSI level after an asset has continued to rapidly lose value signals exhaustion but, without past data to fall back on, the standard playbook for an oversold bounce may come with added risks. The news of the unstaking event was obviously enough to fuel stop-loss orders, resulting in a push below the frequently entered sub-40 zone on the RSI oscillator for many assets.
What is interesting to note is the behavior of RSI during this decline, it didn’t gradually decrease but collapsed from neutral levels above 50 to below 40 in less than two weeks. Therefore, for swing traders, this sharp change in momentum coupled with the overhang of the token unlock implies that any oversold rally could be short-term. This would happen unless buyers emerge with force above the $30 level.
ADX at 24.71 Shows Sellers Just Getting Started
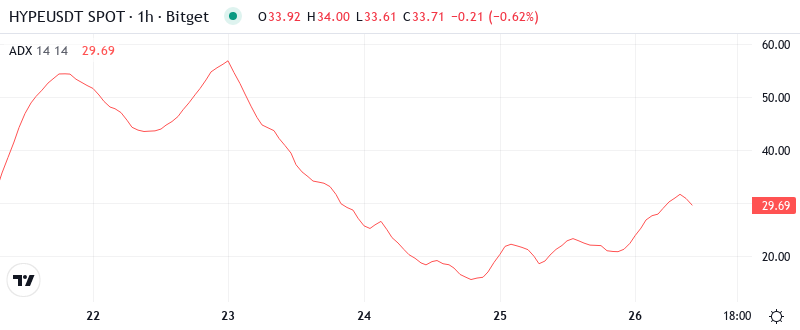
Trend strength as measured by ADX is at 24.71, crossing over that main 25 threshold separating choppy from trending. We are leaving the consolidation phase that dominated mid-December and going into a directional swing – a move that leans solidly on the downside right now. ADX moving up confirms these aren’t just profit takers, but a real shift in trends after the $316M of the unstaking news hit the wires.
ADX rose from the low teens to almost 25, momentum traders using trend-trading techniques finally got a sign. In other words, day traders need to shift from range-trading to trend-continuation strategies, especially on bounces back to resistance. The unlock event on the horizon implies that there is logical pressure for this downtrend beyond simply technical trading.
50-Day EMA at $38.43 Caps Rally Attempts
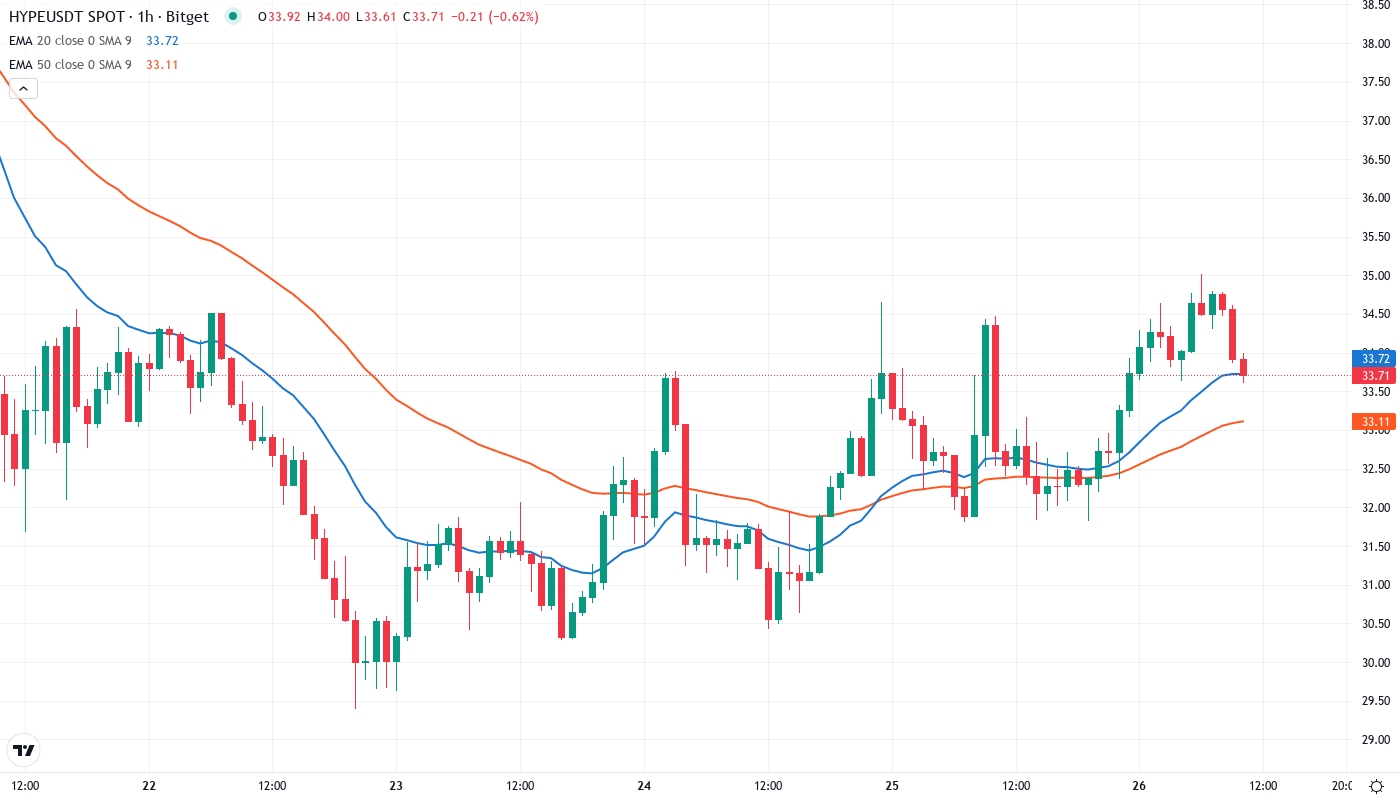
The EMA structure clearly tells the story price action is starting to get ugly. The 10-day EMA was backtested as resistance on this week’s relief bounce. The 10-day EMA is currently at 37.90 and will likely cross down through the 20-day EMA at 39.62 which has been acting as support the past six months. The 50-day EMA has also been acting as support for the past six months and currently sits at 38.43. This confluence of EMAs forming a resistance cluster between 37.90-39.62.
Even more concerning is the typical build in of a short interest around $50-55, who are doubling as pissed-off folks who bought in the private late-stage $90M fundraiser. That’s a lot of ammunition set to unload if there’s any sign of a “rally” starting, which in penny stock land is often self-defeating, as nothing invites the selling hammer like the prospect of a bit of price appreciation to cover your losses as a short or discounted long.
Monthly Low at $29.39 Becomes Critical Support Test
Sellers are offered at higher levels between $37.90 (10-day EMA) and $50.15 December high, with strong cluster around $38-$39 zone. The 20-day EMA is seen at $39.62 which will likely cross the $40 mark central handle, while $40.72 is the confluence of 50 and 100-day EMAs. This level should act as the immediate barrier. Later on, bull’s quest to recovery would temperature up with the 200-day EMA at $46.72.
Buyers who have taken the time to consider the long-term value proposition of UNI might be eyeing the monthly low as an opportunity to accumulate more. The oversubscribed demand for Uniswap V3 access during the announcement confirmed there’s plenty of traders looking to scoop up discount assets.
The market structure shows an unusual disconnect – price established new lows whereas the ADX had not reached into overextended territories above 40, which means this downtrend could sprawl a bit more. The $316M unstaking essentially front-runs the unlock, probable dampening some of the selling demand, but the market isn’t buying it with traders still holding the $38-39 resistance line.
Token Unlock Overhang Keeps Bulls Sidelined Below $40
If the price is able to recover the 10-day EMA at $37.90, bulls may set their sights on the resistance cluster in the $38-39 range, where the 50-day EMA meets the psychological benchmark. This will necessitate taking in both technical selling at moving averages and fundamental selling from the unlock event. It’s probably going to be difficult, which means the longs needing to have positive catalyst news to go off of in order to push through what may be oversold conditions.
If the $29.39 support holds, the stock could eventually test the broken two-year low near $33.50 but that may not happen for months. More immediately, it will bounce back to the August 30 breakdown through the 200-day EMA at $38.75, which is reinforced by the .382 Fibonacci sell-off retracement level.
Due to technical impairment and fundamental resistance caused by the $314M token unlock, the most likely short-term direction is further downward pressure on support at $29.39, with any upticks encountering strong resistance in the EMA cluster zone between $37.90 and $39.62.