Toncoin Plunges 29% as $67M Token Unlock Amplifies Selling Pressure
Market Structure Shifts Lower
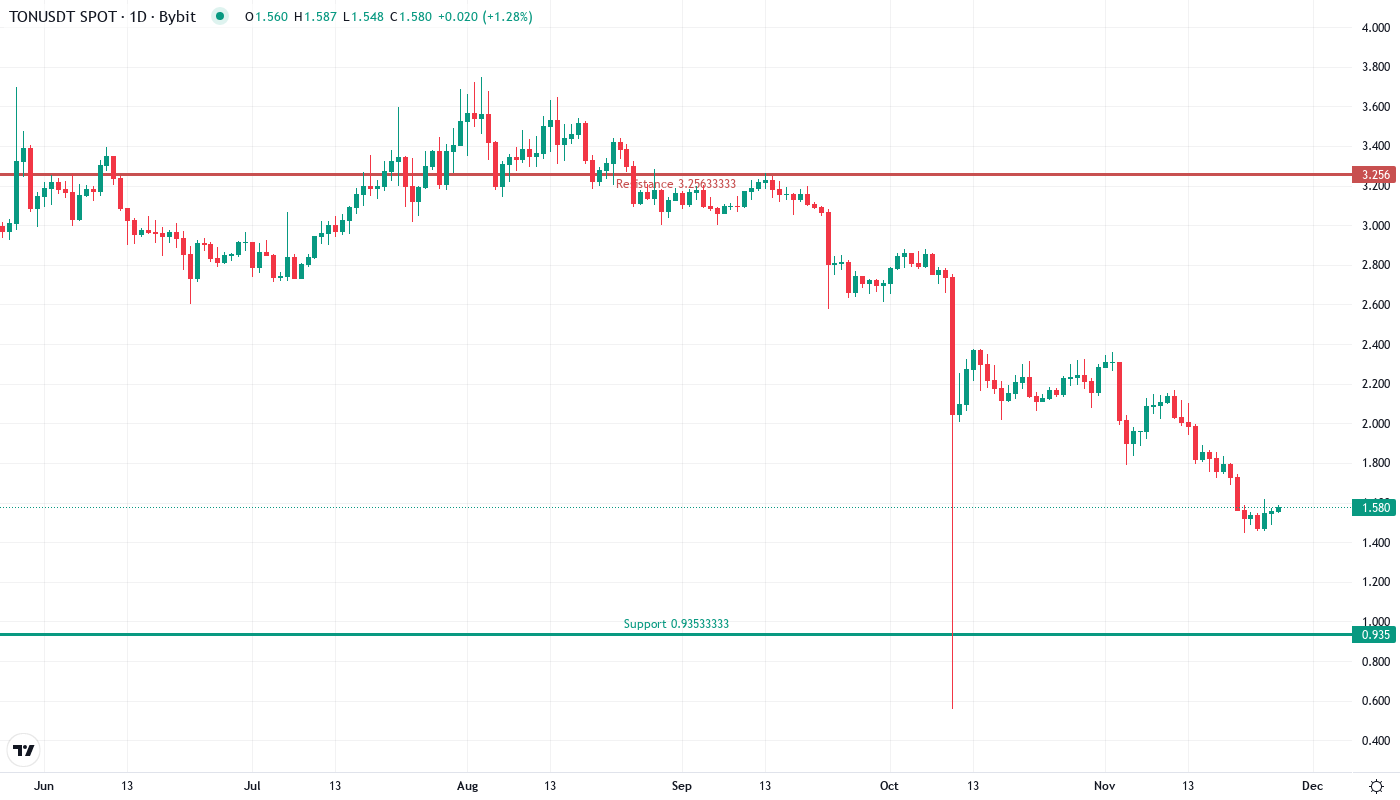
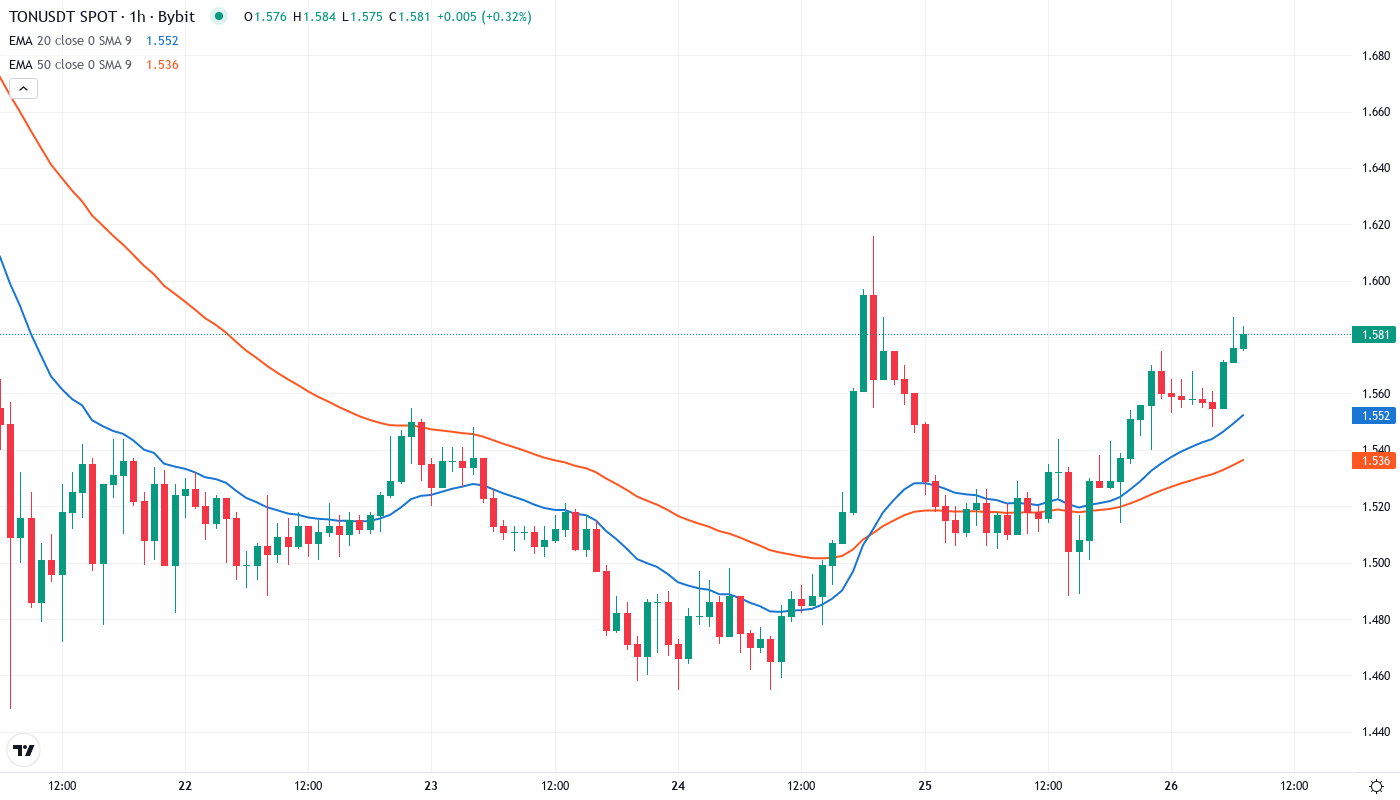
- TON drops to $1.58 after testing yearly lows near $1.45 – down 74% from all-time highs
- $67 million token unlock hits already-fragile market structure, accelerating the descent
- Coinbase roadmap inclusion and Europe’s first TON ETP provide limited cushion against broader selloff
Toncoin has endured a devastating drop over the past month, shedding 29.2% to trade at $1.58 as the combination of a major token unlock and deteriorating market structure pushed price through multiple support levels. The $67 million unlock event – representing the week’s largest single token release – arrived at the worst possible time, with TON already testing yearly lows near $1.45. Despite positive developments including Coinbase’s roadmap announcement and CoinShares launching Europe’s first Toncoin ETP, these catalysts proved insufficient against the wave of new supply hitting an already-weakened market. The main question for traders is: can institutional product launches provide enough demand to offset ongoing unlock pressure, or will TON continue bleeding toward the $1.00 psychological level?
| Metric | Value |
|---|---|
| Asset | TONCOIN (TON) |
| Current Price | $1.58 |
| Weekly Performance | -12.14% |
| Monthly Performance | -29.22% |
| RSI (Relative Strength Index) | 32.7 |
| ADX (Average Directional Index) | 55.4 |
| MACD (MACD Level) | -0.17 |
| CCI (Commodity Channel Index, 20-period) | -80.90 |
RSI at 32.7 Signals Oversold Territory – But No Divergence Yet
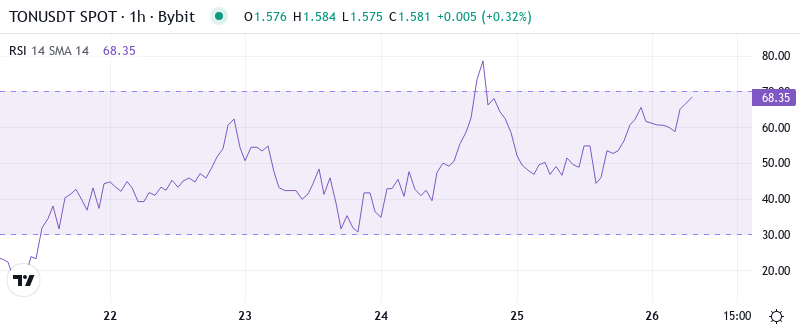
RSI sits at 32.7 on the daily timeframe, marking the second consecutive week in oversold territory after the token unlock announcement triggered accelerated selling. This reading matches levels last seen during the August 2024 washout, when TON briefly touched $1.20 before staging a relief rally to $2.80. What’s revealing is how RSI barely budged despite the Coinbase roadmap news – typically a catalyst that would spark momentum shifts – suggesting sellers remain firmly in control.
Looking at the weekly timeframe provides additional context: RSI reads 28.8, approaching levels that historically marked significant bottoms for TON. The September 2023 capitulation saw weekly RSI hit 26 before a 180% recovery over the following quarter. So for swing traders, this oversold condition combined with positive institutional developments creates an interesting risk-reward setup, though the absence of bullish divergence warns against catching this particular falling knife just yet.
ADX at 55.4 Confirms Mature Downtrend Nearing Exhaustion
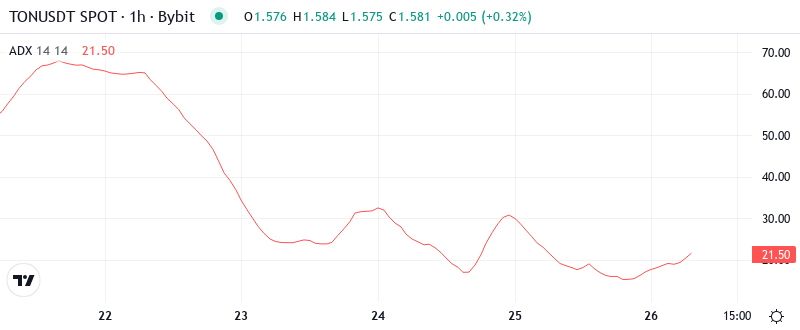
At the level of 55.4, the ADX reading indicates we’re witnessing one of the strongest trending moves in TON’s history – unfortunately for bulls, it’s pointing straight down. This extreme reading surpasses even the March 2024 selloff when ADX peaked at 48, and suggests the $67 million unlock created a liquidity vacuum that amplified an already-established downtrend. Basically, when ADX climbs above 50, it often signals trend exhaustion rather than continuation.
Historically, such extreme ADX readings for TON have preceded sharp reversals or at least extended consolidation periods. The institutional product launches – particularly CoinShares’ ETP providing regulated exposure to European investors – could serve as the catalyst for trend exhaustion. Therefore, day traders should prepare for increased volatility as this mature trend shows signs of running out of steam, with whipsaws likely as the market digests both the unlock overhang and new institutional on-ramps.
20-Day EMA at $1.86 Now Acts as Dynamic Resistance
Price action through the EMA ribbons tells a brutal story of systematic support failures. TON currently trades below the entire moving average stack, with the 10-day ($1.62), 20-day ($1.75), and 50-day ($2.05) EMAs all sloping downward. Most significantly, the 20-day EMA that provided support throughout November flipped to resistance after the token unlock news, rejecting price three times in the past week alone.
The 200-day EMA looms far above at $2.39, representing a 51% premium to current levels and highlighting just how severely this correction has damaged the technical structure. That said, the compression between the 10-day and 20-day EMAs suggests a potential volatility squeeze building – the Coinbase listing could provide the spark for an explosive move in either direction. For now, bulls need to reclaim and hold above $1.75 to even begin discussing trend reversal.
Support at $1.45 Tested Three Times – $1.00 Psychological Level Next
Resistance stacks heavy between the 20-day EMA at $1.75 and the monthly pivot at $1.91, creating a formidable barrier for any recovery attempts. The December highs near $2.36 feel like ancient history now, requiring a 49% surge just to revisit – and that’s before confronting the 200-day EMA overhead. Even with Coinbase listing momentum, sellers defend this zone aggressively as trapped longs use any bounce to reduce positions.
Support structure looks marginally better thanks to the triple bottom formation at $1.45, where buyers emerged three times over the past two weeks. This level gains additional significance as the yearly low, making it a red line for bulls to defend. The weekly pivot at $1.91 also provided a brief bounce, though it quickly flipped to resistance as the unlock supply overwhelmed demand.
Market structure reveals an uncomfortable truth: despite positive fundamental developments, technical damage runs deep. The measured move from the $2.36 breakdown targets $1.00 – the next major psychological level where institutional buyers might step in given the new ETP access. Bulls desperately need the Coinbase listing to generate enough volume to absorb remaining unlock pressure, or this support architecture collapses entirely.
Coinbase Listing Must Spark Recovery Above $1.75 or $1.00 Beckons
Bulls require a decisive daily close above $1.75 to neutralize immediate downside pressure and establish a higher low. The combination of Coinbase retail access and institutional ETP demand could provide the necessary fuel, particularly if Bitcoin stabilizes and provides a broader market tailwind. Should this occur, initial targets sit at $1.91 (monthly pivot) followed by $2.05 (50-day EMA).
The bearish scenario triggers if $1.45 support fails on volume, confirming the measured move target toward $1.00. This would trap recent ETP investors and likely cascade into panic selling as the psychological round number breaks. With 55% of the token unlock still impacting market dynamics and RSI showing no divergence yet, sellers maintain the upper hand until proven otherwise.
Given the extreme oversold conditions, mature downtrend exhaustion signals, and positive institutional developments on the horizon, the most probable near-term path sees TON establishing a bottom between $1.45-$1.58 before attempting a relief rally toward $1.75-$1.91. However, traders should expect continued volatility as unlock supply gets absorbed and the market prices in the Coinbase listing impact.