LEO Darts Above $9.60 as Momentum Resets From Overbought Territory

Market Pulse
- The LEO price is currently at $9.646, with weekly gains of 1.42%, which are relatively small considering the weakness in the cryptocurrency market as a whole.
- The Relative Strength Index (RSI) has decreased to 60.68 after reaching overbought levels in December, which could indicate room for further positive momentum.
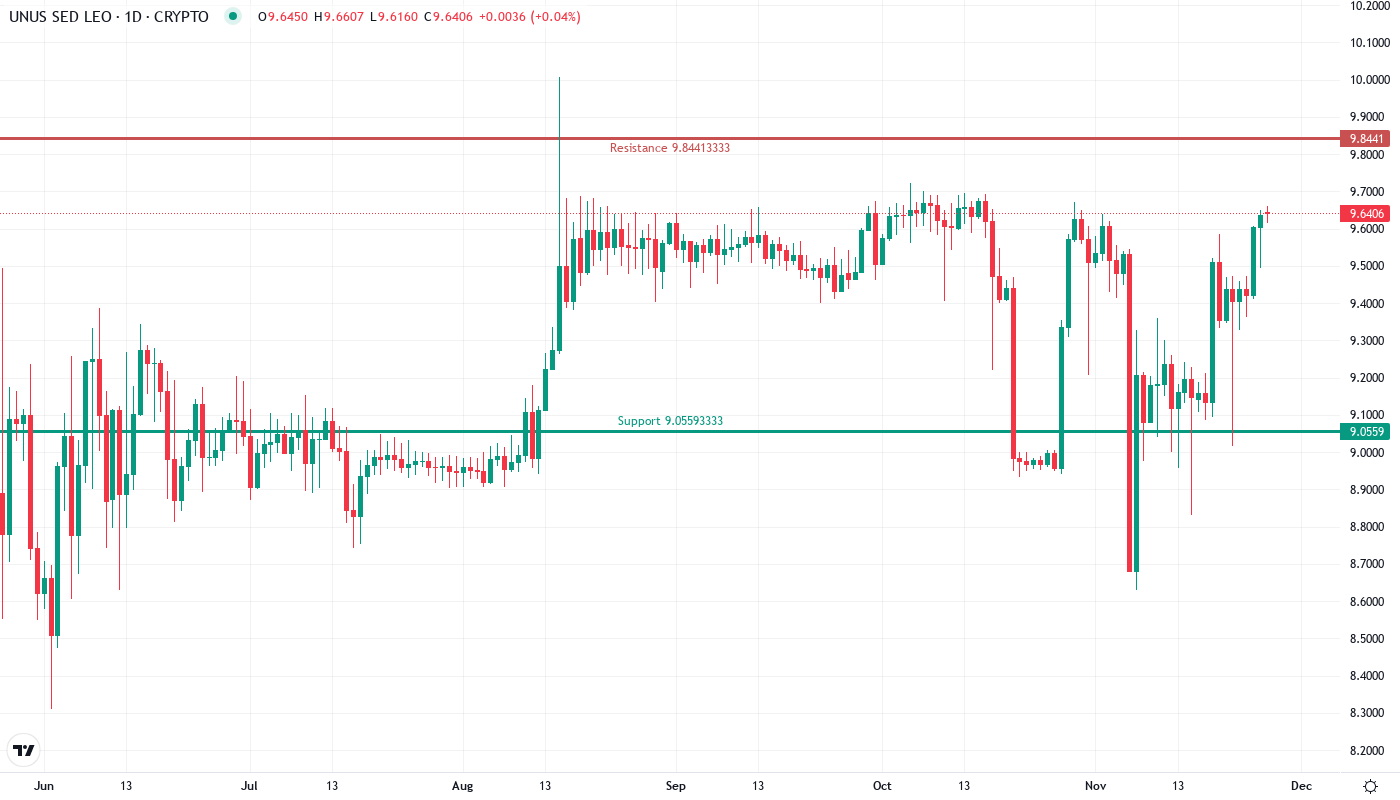
- Bulls are trying to keep the important support level at $9.38, and if this holds, they will likely aim at the resistance zone around $10.17.
Despite relatively high and rising allocations to USDT, Bitfinex’s large positions in decentralized finance (DeFi) projects were compounded by gross short positions on major cryptocurrencies early in the year. The March meltdown prompted a harrowing spike in the cost to borrow dollars on the platform, with many attributing a broader scramble for the fiat amid sliding prices and potential margin calls to liquidations on BitMEX.
| Metric | Value |
|---|---|
| Asset | UNUS SED LEO (LEO) |
| Current Price | $9.65 |
| Weekly Performance | 1.42% |
| Monthly Performance | 7.69% |
| RSI (Relative Strength Index) | 60.7 |
| ADX (Average Directional Index) | 30.7 |
| MACD (MACD Level) | 0.07 |
| CCI (Commodity Channel Index, 20-period) | 150.92 |
RSI Cools From 77.66 Peak – Bulls Catch Their Breath
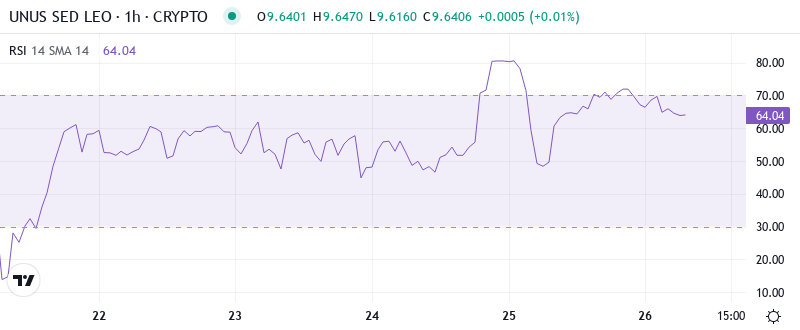
The oscillation indicator is at 60.68 in the daily time frame, the momentum is decreasing from the high 77.66 reading. The LEO is in the bullish area above the neutral 50 line and the extremely tense condition is cleared that usually comes before sharp turns. In essence, the token was bought more than it should but did not give in – return to the pullout point healthy reading.
In early December, LEO had similar RSI settings which ended up being an excellent entry point for a swing trade that saw prices skyrocket from $8.60 to where they currently sit. The fact that the weekly RSI is sitting at 56.86 tells us all we really need to know – this isn’t overextension, it’s consolidation. This means swing traders have a great risk/reward spot to try their luck, with stops relatively easy to position beneath support and resistance located at $10.17-$10.96 above.
ADX at 30.66 Signals Genuine Trend Strength Building
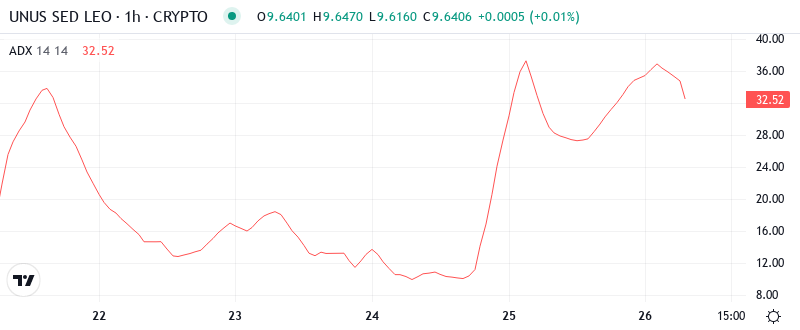
The latest readings on trend strength indicate a more positive trend as the ADX has increased beyond 30.66. This is significantly higher than the 25-point benchmark that distinguishes sideways markets from the ones with a defined trend. It signifies that the current action is characterized by a clear trend rather than back-and-forth trading. This increase from less than 20 marks a notable change in the overall market.
What is most notable is that this trend strength became evident as the price grind higher opposed to a spike which indicated that advances were driven by accumulation rather than speculative bubble. Hence, day traders will need to adjust their approach to taking advantage of trend-following setups rather than mean reversion plays as the current market conditions will likely encourage continuation rather than snappy reverse moves.
20-Day EMA at $9.40 Transforms Into Bull Defense Line
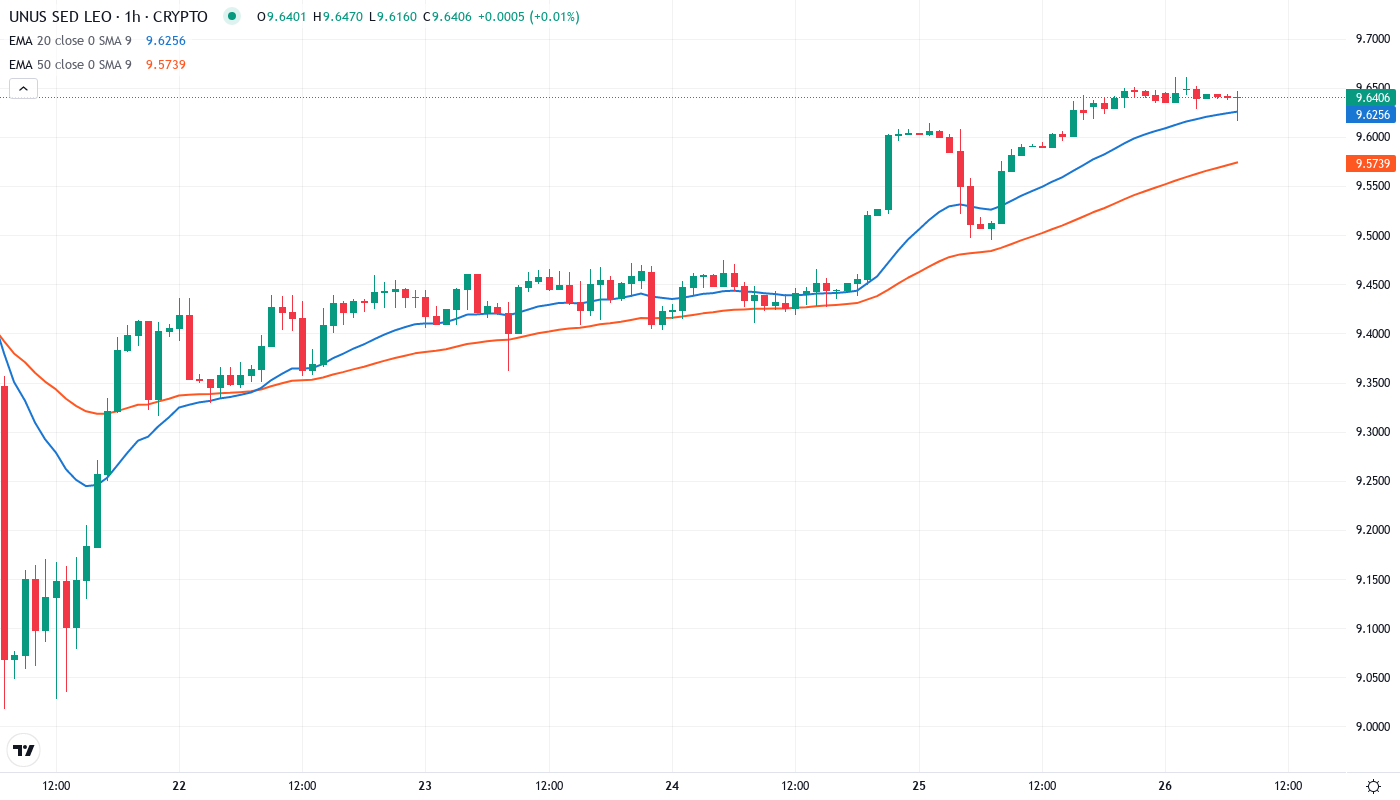
The moving average structure suggests that bulls are in the driving seat. LEO trades above all the important average levels with the 10-day EMA bought at ($5.084), the 20-day EMA at $5.22, and the 50-day EMA at $5.09.
The 20-day EMA has turned higher and is bringing the faster moving averages along for the ride. These indications point to price trading above the macro equilibria that the EMAs set, which is conducive to bullish continuation. Serial higher highs and higher lows on declines are adding weight to the bullish argument. Next up is the 38.2% Fibonacci retracement level at $9.465 with the 50-day SMA currently at $9.478 closing in fast. A decisive push through this region would signal the right time for bears to start looking for standing aside.
Resistance Stack Between $10.17 and $10.96 Gates Next Leg Higher
Sellers have built up strong positions above the current price. The first resistance is at $10.17, where the monthly R1 pivot level meets the psychological round number resistance. This level held gains in the first leg of December’s uptrend, and thus bulls need to perform exceedingly well.
The bulls also have a significant resistance area starting at the very important $9.60 level. Above that, the 100-day EMA is overhead at $9.79, which has contained the price since the death cross. If the price can manage to overcome both, horizontal resistance at $9.90, the 50-day EMA at $10.20 and the overhead trendline near $10.75 should provide subsequent resistance.
Based on historical percentage moves, the potential for a 10-15% variance is most often based on the zone (sum of percentages) between the moving averages (currently 5%) and the Fibonacci / linear regression of the gain/loss over the previous quarter. If the breakout fails to close over the 50d, strong caution is warranted.
Bulls Need Daily Close Above $10.17 to Unlock $10.96 Target
If the price should drop back below $10.17, we’d have to return to a neutral-to-bearish stance. Support is not well-defined except for the possible backtest of the breakout.
If LEO fails to hold the crucial $9.38-$9.40 support zone, the bearish scenario will play out. A breakdown is likely to push positions down to $9.05 first, and if selling intensifies, it could drop to the monthly S2 at $7.85. In this case, buyers from the recent advance would be trapped, and the intermediate trend structure would become bearish.
Based on the technical setup – cooling RSI, rising ADX, and price holding above key moving averages – the most likely short-term scenario has LEO consolidating between $9.40-$9.65 before taking another shot at $10.17 resistance. The contracted volatility and constructive momentum reset indicate an eventual breakout to the upside within the next 5-7 sessions.