Mantle Tumbles 40% From Monthly High as Institutional Adoption News Fails to Halt Decline
Market Pulse
- MNT crashed 40% from December’s $1.80 peak despite three major institutional partnerships
- RSI plunged into oversold territory at 33.46, matching levels last seen during market-wide capitulation events
- Support architecture crumbles as price trades below entire EMA stack for first time since November
Mantle’s native token MNT experienced a devastating drop this past month, shedding nearly 40% from its monthly high of $1.80 to current levels near $1.00. The collapse accelerated despite a flurry of institutional adoption news – including partnerships with Chainlink, DMZ Finance for the world’s first DFSA-approved tokenized money market fund, and custody integration with Anchorage Digital. What’s particularly striking is how these typically bullish catalysts failed to provide any floor for the price action, suggesting deeper structural issues at play. The main question for traders is: has MNT found a bottom after this 40% washout, or does the technical damage signal more pain ahead?
| Metric | Value |
|---|---|
| Asset | MANTLE (MNT) |
| Current Price | $1.00 |
| Weekly Performance | -9.75% |
| Monthly Performance | -39.78% |
| RSI (Relative Strength Index) | 33.5 |
| ADX (Average Directional Index) | 31.3 |
| MACD (MACD Level) | -0.13 |
| CCI (Commodity Channel Index, 20-period) | -97.86 |
Momentum Exhaustion Signals Capitulation Phase – RSI Hits Multi-Month Lows
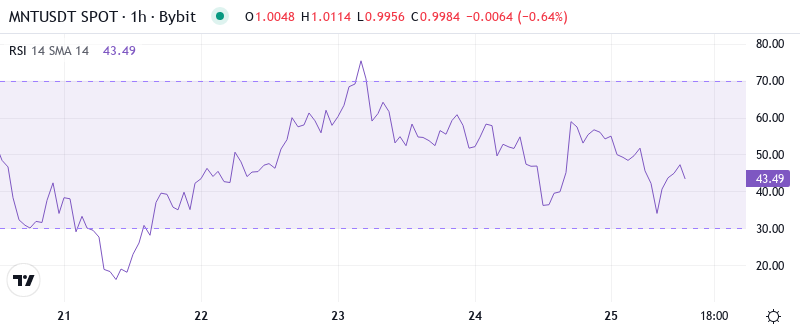
RSI sits at 33.46 on the daily timeframe, marking the first genuine oversold reading since the broader market correction in August. This level represents a critical psychological threshold where historically, MNT has staged relief bounces – though not always sustained ones. The velocity of this decline pushed momentum indicators to extremes rarely seen outside of market-wide liquidation events.
Similar RSI configurations below 35 have preceded sharp rebounds in three of the past four occurrences for MNT. However, what’s different this time is the complete absence of buying interest despite the institutional partnership announcements. So for swing traders, this oversold bounce potential exists, but the lack of fundamental support during positive news flow suggests any relief rally might face immediate selling pressure.
ADX at 31.33 Confirms Mature Downtrend With Conviction
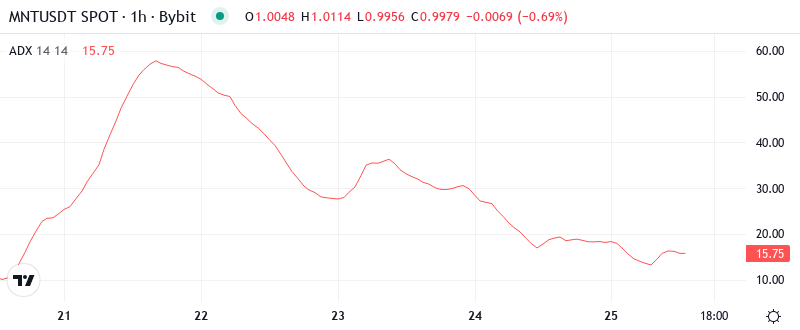
Looking at trend strength, the ADX reading of 31.33 indicates we’re dealing with a legitimate trending move, not just choppy consolidation. The indicator climbed steadily as sellers took control, crossing above 25 about two weeks ago when MNT first broke below $1.40. This isn’t a fake-out or a temporary dip – it’s a directional move with conviction behind it.
To clarify, an ADX above 30 typically signals that the prevailing trend has momentum and isn’t likely to reverse without a significant catalyst. The partnership news clearly wasn’t enough. Therefore, day traders should align their strategies with the downtrend until ADX drops back below 25, signaling exhaustion. The fact that positive news couldn’t even dent this trending condition speaks volumes about underlying distribution.
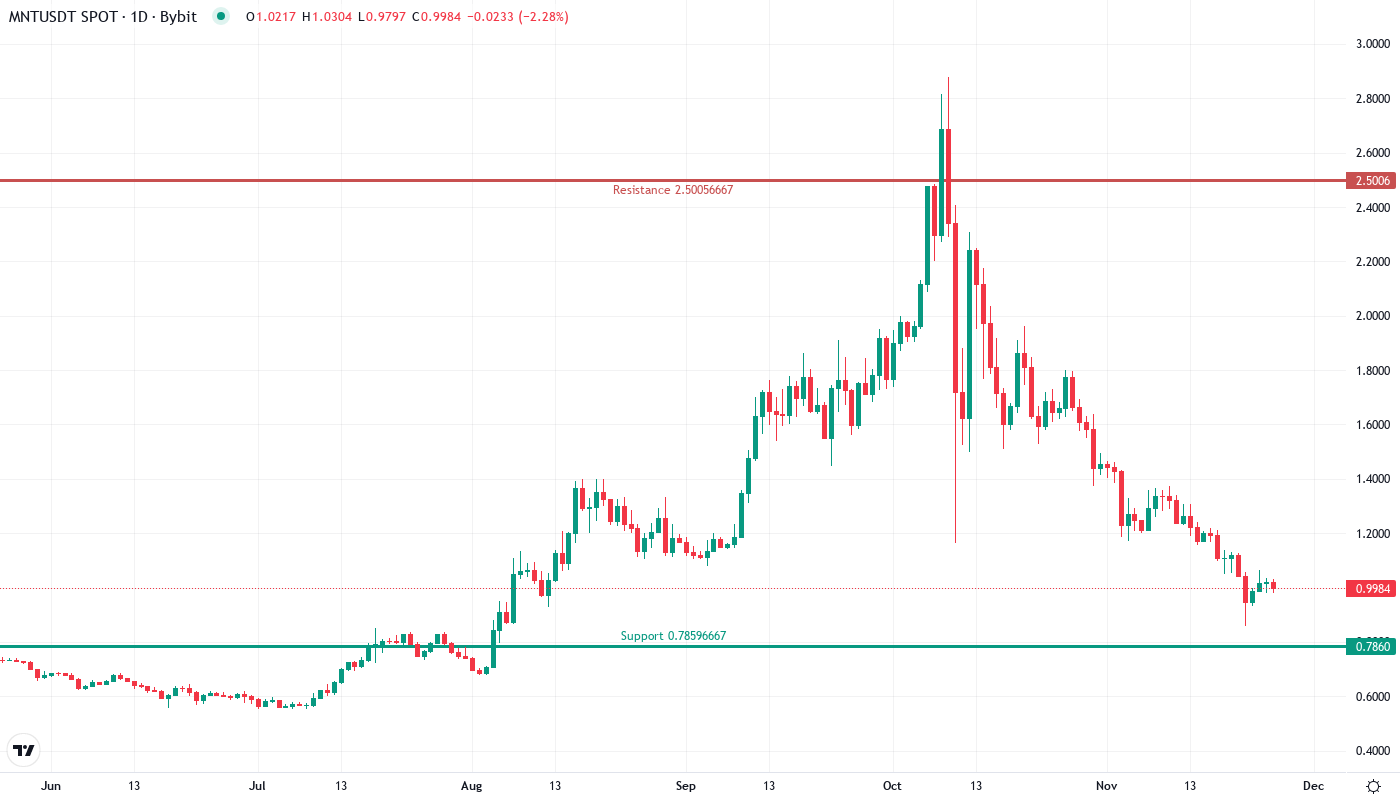
Price Trapped Below Entire EMA Cloud Since Breaking $1.24 Support
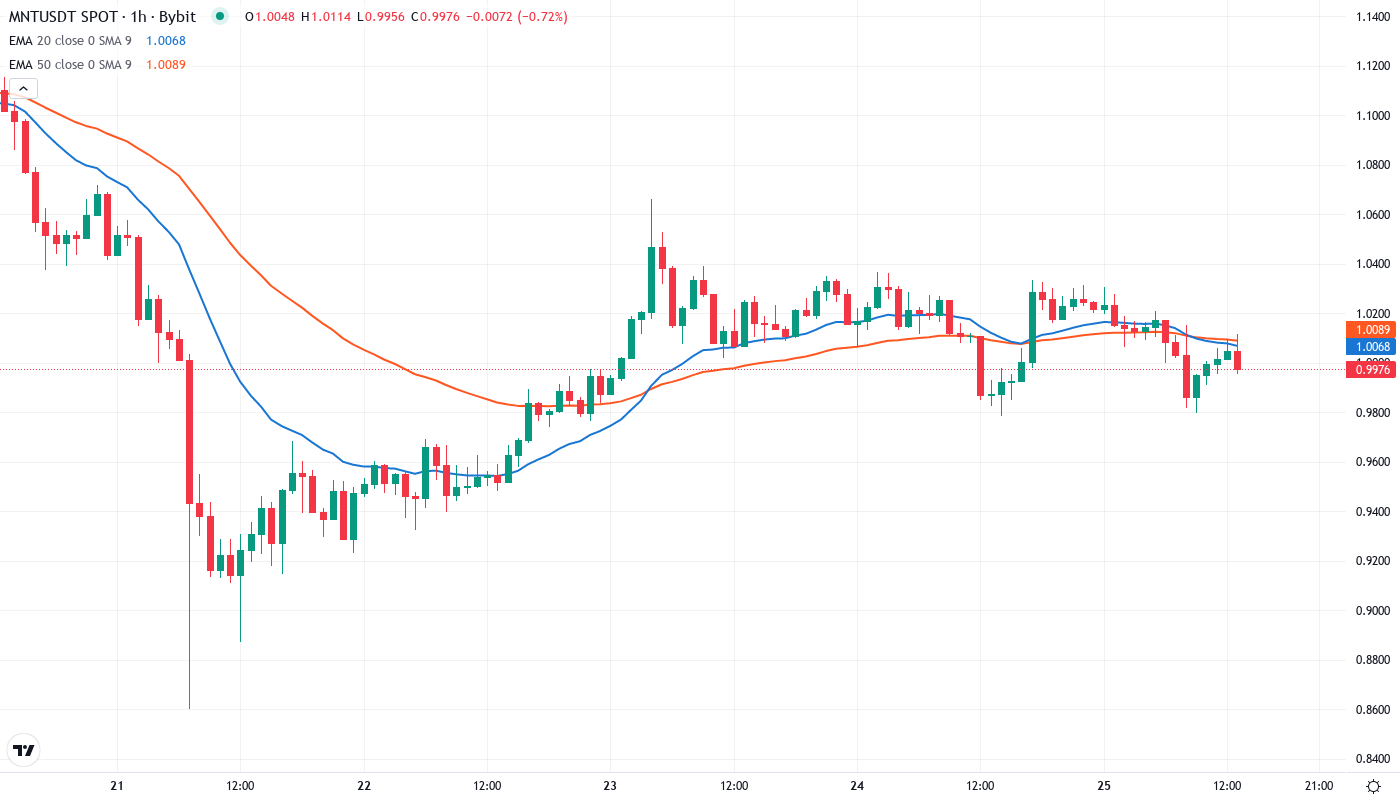
The moving average structure paints a grim picture for bulls. MNT currently trades at $0.999, sitting below the 10-day ($1.06), 20-day ($1.16), 50-day ($1.24), and crucially, the 100-day EMA at $1.37. This complete bearish alignment happened rapidly – just three weeks ago, price was above all these levels. The 50-day EMA at $1.24 acted as support during the early December consolidation before dramatically failing.
What’s particularly revealing is how the 20-day EMA flipped from support to resistance after MNT failed to reclaim it following the Anchorage Digital partnership announcement. That rejection at $1.16 essentially confirmed the bearish structure. The former support cluster between $1.24-$1.37 now acts as a formidable resistance zone that would require significant volume and momentum to overcome – neither of which appears forthcoming given current market dynamics.
Resistance Stacks Heavy Between $1.13-$1.37 While Support Remains Questionable
Above current price, sellers have fortified multiple resistance layers. The immediate ceiling sits at $1.13 where the monthly pivot point converges with recent breakdown levels. More substantial resistance emerges at $1.24 (50-day EMA and December’s support-turned-resistance), extending up to $1.37 where the 100-day EMA meets November’s consolidation zone. Any rally attempt would need to clear this entire stack to signal a genuine reversal.
Support structure below looks fragile after the recent collapse. The psychological $1.00 level offers the first test, followed by the monthly S1 pivot at $0.933. However, given how easily previous support at $1.24 crumbled despite positive fundamentals, these levels inspire little confidence. The November low near $0.86 represents the next major historical support, though reaching it would mean a 50% drawdown from December highs.
Market structure reveals systematic distribution despite the institutional adoption narrative. The failure of positive news to arrest the decline – or even generate a meaningful bounce – suggests either significant insider selling or a broader rotation out of the Mantle ecosystem. This disconnect between fundamentals and price action typically resolves in favor of price, meaning the technical damage likely reflects underlying issues not yet public.
Bulls Need Decisive Close Above $1.24 to Reverse Bearish Structure
Bulls require a high-volume daily close above $1.24 to reclaim the 50-day EMA and flip market structure. Such a move would need to be accompanied by fresh catalysts beyond partnership announcements – perhaps meaningful on-chain metrics improvement or broader market recovery. The institutional infrastructure being built (Chainlink integration, regulated custody, tokenized funds) could eventually provide the foundation for recovery, but timing remains uncertain.
The bearish scenario accelerates if MNT loses the psychological $1.00 support on volume. A breakdown here would likely trigger stop-loss cascades targeting $0.93 initially, with potential to test November’s $0.86 low. The complete failure of bullish news to generate buying interest suggests any bounces should be viewed skeptically until proven otherwise with sustained moves above key resistance.
Given the technical damage and news-price disconnect, the most probable near-term path sees MNT grinding between $0.93-$1.13 as it attempts to build a base. Without a significant shift in market dynamics or a broader crypto market recovery, the institutional adoption story appears insufficient to drive immediate price appreciation. Traders should respect the established downtrend until clear evidence of accumulation emerges above key moving averages.