Solana Tests Crucial $136 Zone as ETF Interest Surges Despite Monthly Washout

Market Structure Shifts Higher
- SOL rebounds from $131 support after devastating 29.5% monthly decline
- Institutional momentum builds with CME futures and consistent ETF inflows
- RSI signals oversold bounce potential while ADX shows trending conditions strengthening
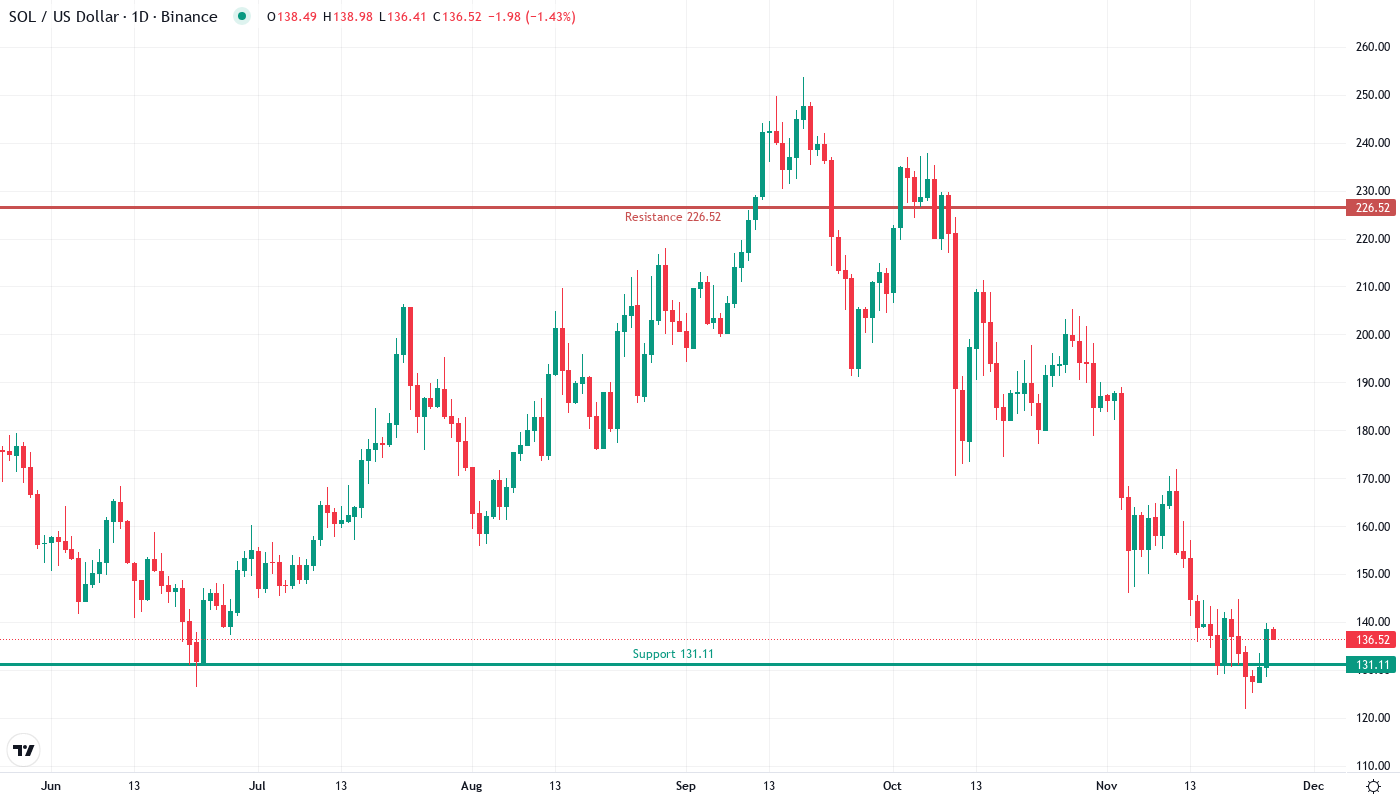
Solana’s price action tells a tale of two timeframes – while the monthly chart shows a devastating drop of 29.5% from $205 highs, the immediate picture reveals bulls defending critical support at $131 and pushing price back to $136.61. The rebound gains significance as institutional players pile into Solana ETFs with consistent capital inflows, while CME’s preparation of spot-quoted SOL futures signals expanding altcoin exposure among traditional finance giants. The main question for traders is: can this institutional bid provide enough fuel to reverse the monthly downtrend, or will sellers reassert control at overhead resistance?
| Metric | Value |
|---|---|
| Asset | SOLANA (SOL) |
| Current Price | $136.61 |
| Weekly Performance | 4.29% |
| Monthly Performance | -29.52% |
| RSI (Relative Strength Index) | 39.1 |
| ADX (Average Directional Index) | 48.7 |
| MACD (MACD Level) | -12.10 |
| CCI (Commodity Channel Index, 20-period) | -43.06 |
RSI at 39.14 Matches Historical Bounce Zones – Bulls Eye Recovery
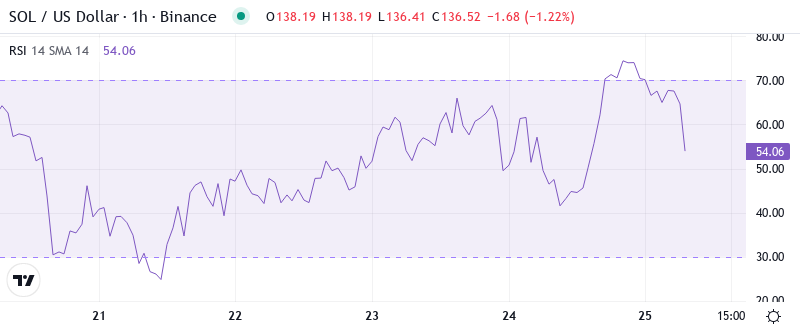
Reading the oscillator at 39.14, traders see classic oversold conditions that historically preceded significant bounces in Solana’s price action. This level mirrors configurations from August and September when similar RSI readings marked intermediate-term bottoms before 20-30% relief rallies materialized. The momentum exhaustion aligns perfectly with the $131 support hold that technical analysts highlighted, suggesting sellers may have overextended their hand.
What’s particularly revealing is how RSI behaved during the recent plunge – it didn’t crater below 30 despite the 29.5% price collapse, indicating underlying strength even as weak hands capitulated. So for swing traders, this balanced oversold reading combined with growing ETF inflows creates an asymmetric risk-reward setup where downside appears limited while upside potential expands. The SEC’s rare no-action letter for Solana’s DePIN project FUSE adds regulatory clarity that could accelerate the momentum shift.
ADX Climbs to 48.75 – Trend Followers Gain Edge as Volatility Expands
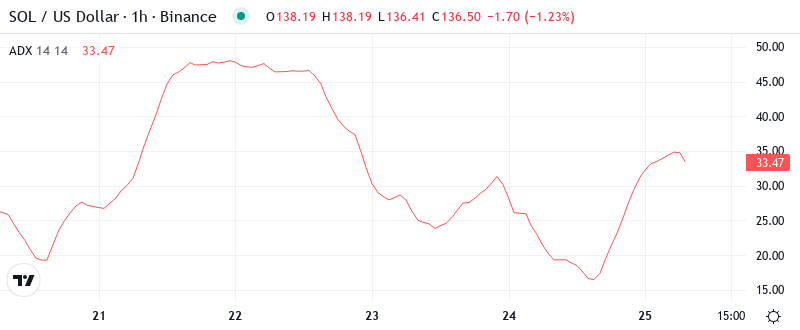
At the level of 48.75, the ADX entry indicates exceptionally strong trending conditions – a reading that typically appears during major market moves rather than consolidation phases. Basically, being in this zone above 40 tells us the current price action carries conviction, whether bulls can sustain the bounce or bears reassert control. The surge from lower ADX readings suggests we’re transitioning from December’s choppy consolidation into a more directional market.
Trend followers should adapt their strategies to these expanded volatility conditions. Since ADX climbed from the mid-20s during the recent selloff, it confirms genuine selling pressure drove the decline rather than low-volume drift. Therefore, day traders should position for continuation moves in either direction once $136 resolves, as the high ADX reading suggests whatever direction emerges will likely extend further than typical range-bound moves.
20-Day EMA at $145 Becomes First Major Resistance After Support Flip
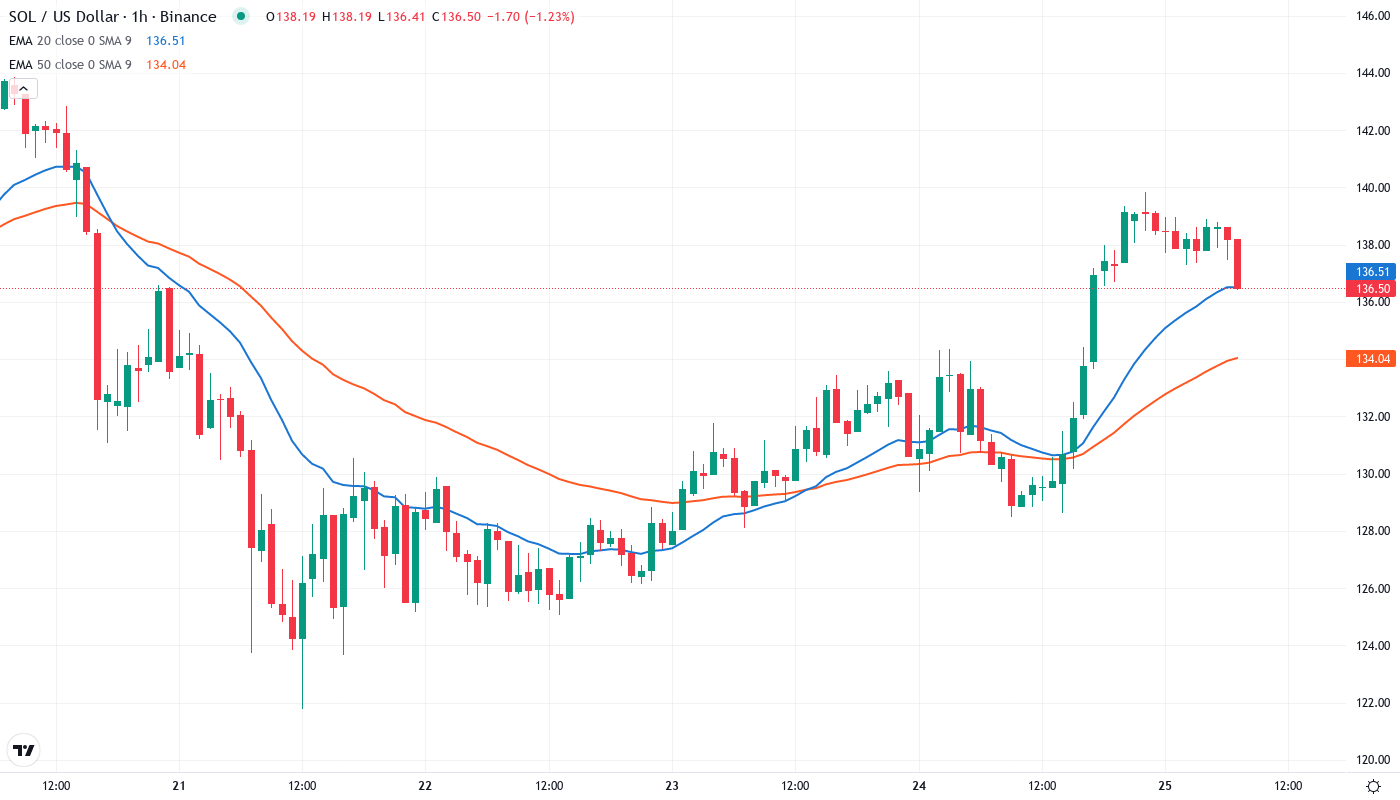
Price action through the EMA ribbons paints a clear picture of the technical damage inflicted during December’s selloff. SOL currently trades below the entire moving average stack – sitting beneath the 10-day ($136.64), 20-day ($145.01), and crucially the 50-day EMA at $153.42. This configuration hasn’t appeared since the summer correction, marking a significant shift in market structure that trapped late buyers above $170.
Bulls face a challenging path ahead with multiple resistance layers stacked overhead. The 20-day EMA at $145 rejected advances twice during the recent decline, transforming from reliable support throughout November into a formidable barrier. It is worth mentioning that reclaiming this level on strong volume would signal the first step toward structural repair, especially with CME futures launch providing fresh institutional liquidity. That former support zone between $145-153 now becomes the red line bulls must conquer to shift momentum decisively.
Resistance Clusters Dense Between $145 and $177 as Bulls Face Uphill Battle
Above current prices, sellers have fortified multiple defense lines that coincide with both moving averages and psychological levels. The immediate resistance zone spans from the 20-day EMA at $145 to the monthly pivot at $155.83, where December’s failed breakout attempts left trapped buyers. This area gains additional significance as it aligns with the 50-day EMA at $153.42, creating a triple confluence of technical barriers.
Bulls now guard the $131-136 support zone that held firm during this week’s test, with the monthly S1 pivot at $131.11 providing the first line of defense. This level proved its worth by triggering the current bounce after six touches since June, earning respect as a reliable floor. The next support layer sits at $122.81 (monthly S2), though losing $131 would likely accelerate selling toward the psychological $100 mark where the 200-day EMA lurks at $115.04.
Market structure reveals an interesting dynamic – while the monthly trend remains decisively bearish with that 29.5% decline, the immediate bounce from oversold conditions combined with surging institutional interest creates a potential inflection point. The concentration of resistance between $145-155 suggests any sustainable recovery must first prove itself by conquering these levels on volume. Meanwhile, consistent ETF inflows provide a fundamental tailwind that wasn’t present during previous corrections.
Bulls Require Decisive Close Above $145 to Confirm Reversal Pattern
Should price reclaim the 20-day EMA at $145 with conviction, bulls could target the $153-155 resistance cluster where both the 50-day EMA and monthly pivot converge. The combination of oversold RSI bounce, strong ADX trending conditions, and accelerating institutional adoption via ETFs and CME futures provides the necessary catalysts for a relief rally. A weekly close above $155 would flip market structure bullish and open paths toward $177.
Bearish pressure returns if SOL fails to hold above $136 and surrenders the recent bounce gains. The critical scenario unfolds with a rejection at $145 followed by a break below $131 support – this would trap recent ETF buyers and likely trigger cascading sells toward $122 and potentially the $100 psychological level. Such a move would confirm the monthly downtrend remains intact despite institutional interest.
Given the oversold bounce from proven support, expanding institutional participation, and favorable regulatory developments with the SEC’s no-action letter, the most probable near-term path sees SOL consolidating between $131-145 while building energy for the next directional move. The high ADX reading suggests this consolidation won’t last long before trending conditions reassert themselves – with institutional flows favoring an eventual upside resolution once overhead resistance clears.