Ethereum Rebounds as U.S. Banks Win Custody Rights, ETF Flows Reverse

Market Structure Shifts Higher
- ETH climbs 6.1% from monthly lows after regulatory breakthrough
- BlackRock leads $92M ETF reversal following 10-day outflow streak
- Technical indicators reset from oversold extremes, momentum building
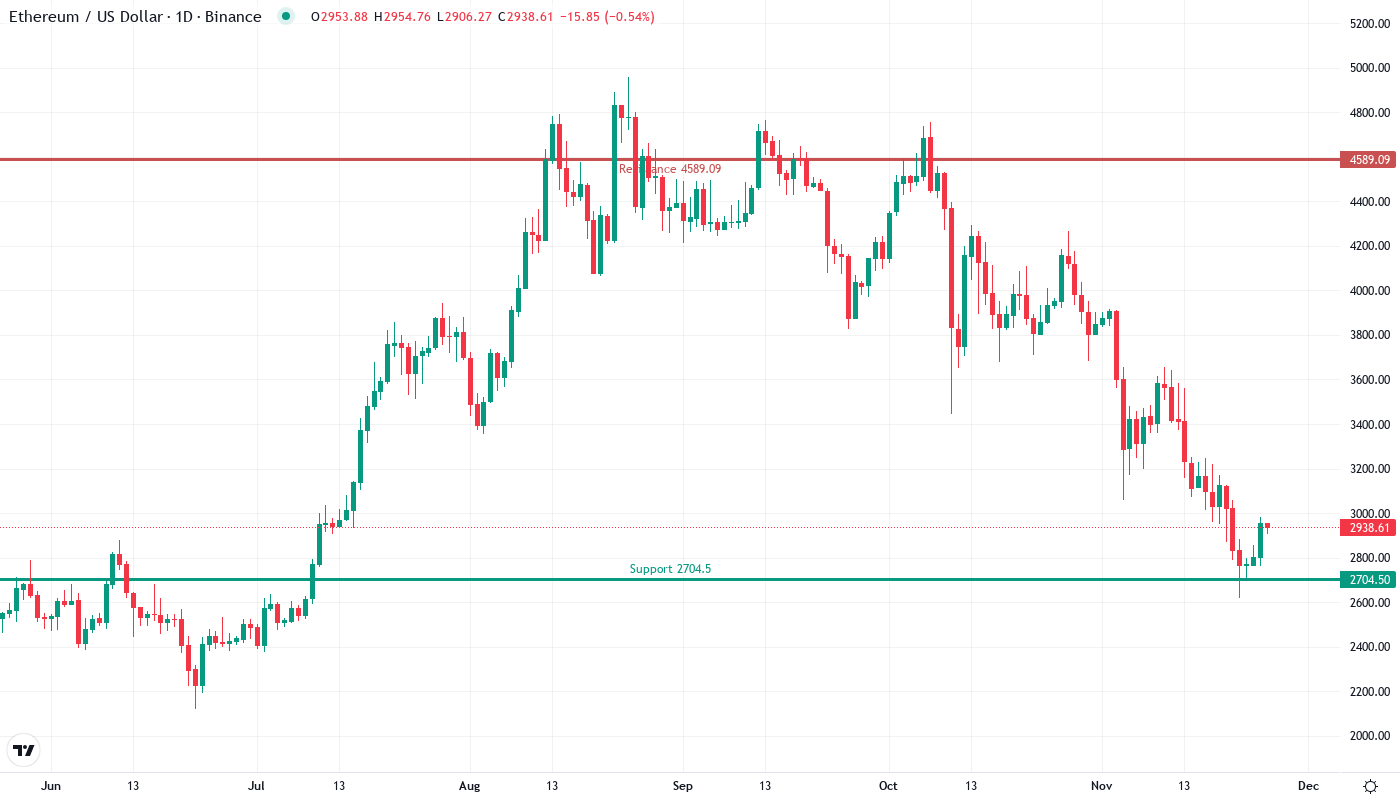
Ethereum darted through key resistance levels this week as U.S. banking regulators delivered a game-changing custody approval, kick-starting institutional flows back into the second-largest cryptocurrency. The devastating drop from $4,266 to December lows of $2,623 – a brutal 38.5% washout – appears to have found its floor as ETH rebounds to $2,933, posting modest weekly gains despite the broader crypto market turbulence. The main question for traders is: Can this regulatory-driven momentum push ETH back above the critical $3,000 psychological level, or will sellers emerge at familiar resistance zones?
| Metric | Value |
|---|---|
| Asset | ETHEREUM (ETH) |
| Current Price | $2933.10 |
| Weekly Performance | -3.23% |
| Monthly Performance | -25.80% |
| RSI (Relative Strength Index) | 37.0 |
| ADX (Average Directional Index) | 47.7 |
| MACD (MACD Level) | -234.81 |
| CCI (Commodity Channel Index, 20-period) | -66.73 |
RSI Bounces From Oversold Territory as Institutional Buyers Return
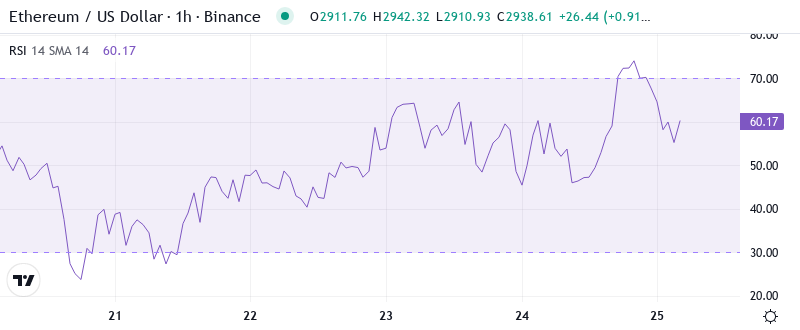
Reading the oscillator at 36.99 on the daily timeframe, Ethereum’s momentum has rebounded from deeply oversold conditions that matched levels last seen during the summer 2024 capitulation. The move from extreme oversold territory below 30 back toward neutral ground signals that the aggressive selling pressure which dominated December has exhausted itself, particularly as the U.S. banking custody news injected fresh institutional interest.
What’s revealing is how RSI behaved during this week’s recovery rally – climbing steadily without spiking into overbought zones, suggesting sustainable accumulation rather than speculative froth. So for swing traders, this measured RSI recovery from oversold extremes means there’s room for continuation toward the 50 neutral mark before momentum gets stretched, especially with the ETF reversal providing fundamental tailwinds.
ADX at 47.65 Confirms Strong Trending Conditions Take Hold
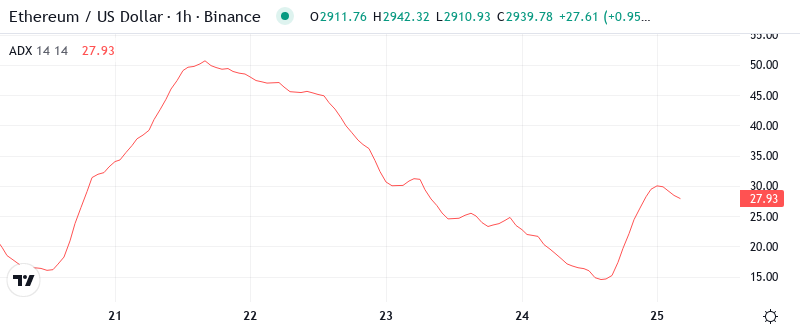
Trend strength readings paint a picture of conviction behind the current move, with ADX sitting at an elevated 47.65 – well above the 25 threshold that separates trending from choppy markets. This high ADX reading indicates we’ve shifted decisively from the sideways grind of early December into a directional market where trend-following strategies gain edge.
Basically, the combination of strong ADX readings and positive regulatory catalysts suggests this isn’t merely a relief bounce but potentially the start of a more sustained recovery phase. To clarify, when ADX climbs above 40 while price rebounds from major lows, it often signals that smart money is positioning for a larger move, and the banking custody approval provides exactly the kind of fundamental shift that can fuel extended trends.
20-Day EMA at $3,135 Becomes First Major Resistance Test
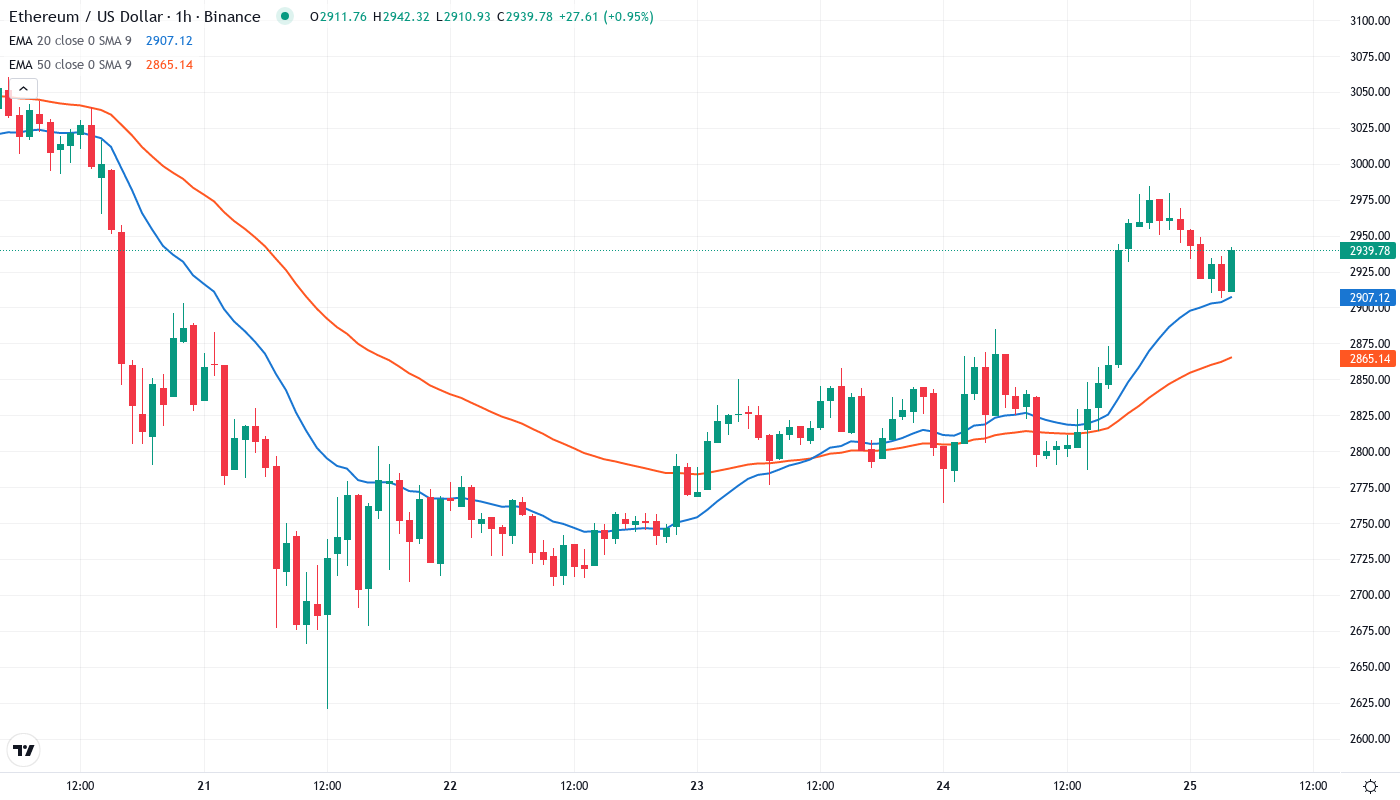
Looking at the moving average structure, Ethereum trades below the entire EMA ribbon, with price currently sitting beneath the 10-day ($2,962), 20-day ($3,135), and crucially the 50-day EMA at $3,288. The 20-day EMA particularly stands out as it rejected advances three times in December before the breakdown, making it the immediate hurdle bulls must clear to shift near-term structure.
More telling is the compression between these averages – the 10-day and 20-day EMAs sit just $173 apart, creating a resistance cluster that could either cap advances or, if conquered decisively on the back of continued ETF inflows, flip to support and accelerate recovery. The 50-day EMA at $3,288 looms as the more formidable barrier, having served as dynamic resistance throughout the December decline.
Resistance Stacks Between $3,000 Psychological and $3,276 Monthly Pivot
Above current price, sellers have stacked multiple resistance layers that bulls must navigate carefully. The immediate psychological resistance at $3,000 coincides with round-number profit-taking tendencies, while the monthly pivot point at $3,276 marks where December’s failed breakout attempts stalled repeatedly.
Bulls defend multiple support layers following this week’s regulatory boost, with the $2,704 monthly S1 providing the nearest downside cushion. The more substantial support zone spans from $2,475 (monthly S2) to the tested monthly low at $2,623, where institutional accumulation emerged as the banking custody news hit the wires.
This configuration resembles a compression pattern between well-defined boundaries – $2,700 support below and $3,000-$3,276 resistance above. The structure favors buyers as long as ETH holds above $2,700 on any retracement, particularly with the fundamental backdrop shifting from regulatory uncertainty to institutional adoption.
Bulls Need Decisive Close Above $3,135 to Confirm Recovery
Should price reclaim the 20-day EMA at $3,135 with conviction, the path opens toward the 50-day EMA at $3,288 and eventually the monthly pivot at $3,276. The combination of reversed ETF flows – particularly BlackRock’s leadership in the $92 million inflow reversal – and banking custody rights creates the fundamental ammunition for such a move.
The setup fails if ETH gets rejected hard at $3,000 and falls back below $2,700 support on heavy volume, which would trap recent buyers who entered on the regulatory news. Such a breakdown would target the $2,475 monthly S2, essentially erasing this week’s gains and suggesting the custody announcement was a “sell the news” event.
Given the technical reset from oversold conditions, strong trend readings on ADX, and game-changing regulatory developments, the most likely short-term path is for Ethereum to challenge the $3,000-$3,135 resistance zone within days. Whether bulls can convert that test into a sustained breakout depends on maintaining the momentum from institutional flows while defending the $2,700 support floor.