APT Slides to Multi-Year Lows as DeFi Integrations Fail to Stem Bearish Tide

Market Structure Moves Lower
- APT crashes 82% from yearly highs, establishing fresh multi-year lows at $2.31
- Major DeFi integrations including Chainlink and USDG0 stablecoin launch provide no price support
- Technical indicators flash oversold extremes across multiple timeframes, yet selling pressure persists
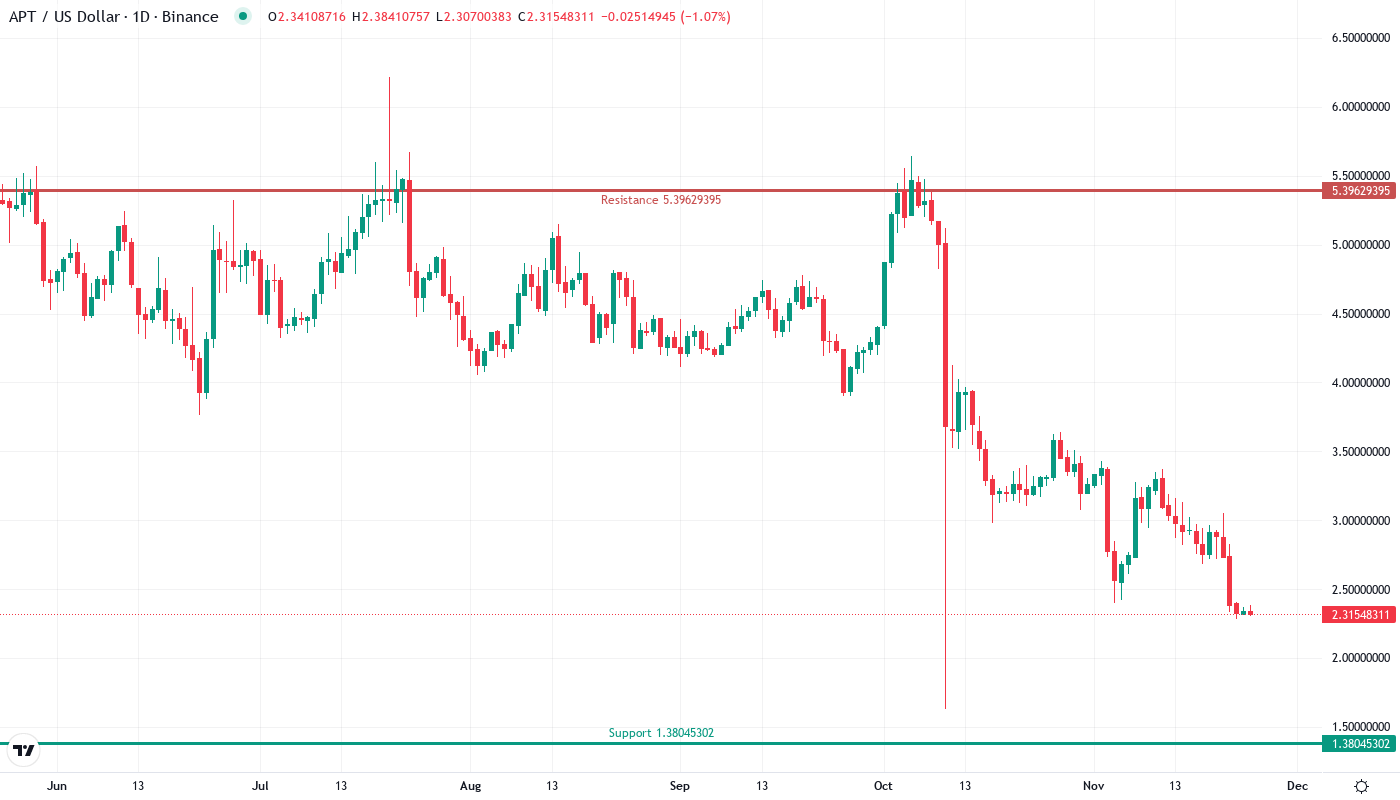
Aptos has delivered one of crypto’s most devastating performances this year, plummeting 82% from its yearly highs to trade at $2.31 – levels not witnessed since the depths of the 2022 bear market. The token shed nearly 30% in just the past month alone, with sellers overwhelming any positive sentiment from recent ecosystem developments including Chainlink’s data streams integration and Paxos’s USDG0 stablecoin launch. The main question for traders is: have we finally hit capitulation levels, or does this former high-flyer have further to fall?
| Metric | Value |
|---|---|
| Asset | APTOS (APT) |
| Current Price | $2.32 |
| Weekly Performance | -18.16% |
| Monthly Performance | -29.99% |
| RSI (Relative Strength Index) | 30.5 |
| ADX (Average Directional Index) | 39.5 |
| MACD (MACD Level) | -0.25 |
| CCI (Commodity Channel Index, 20-period) | -150.02 |
RSI Plunges to 30.51 – Deepest Oversold Reading Since Genesis
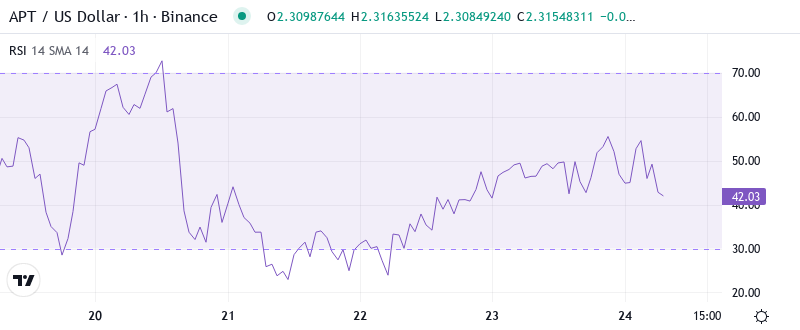
Reading the oscillator at 30.51, traders see momentum indicators screaming oversold on the daily timeframe – territory that typically marks at least a near-term floor. This marks APT’s most extreme oversold condition since its initial listing volatility, suggesting the selling has reached panic proportions. Historically, such deeply oversold readings in established Layer-1 tokens have preceded relief rallies of 15-25%, though the broader trend often continues lower after the bounce.
What’s revealing is how RSI behaved during the recent DeFi announcements – it barely budged above 35 despite the Chainlink integration news, showing how thoroughly broken sentiment has become. So for swing traders, this extreme oversold setup offers a potential bounce play, but the lack of momentum response to positive catalysts warns that any relief rally will likely face heavy resistance from trapped holders looking to exit.
ADX Surges to 39.51 – Confirming Powerful Downtrend Momentum
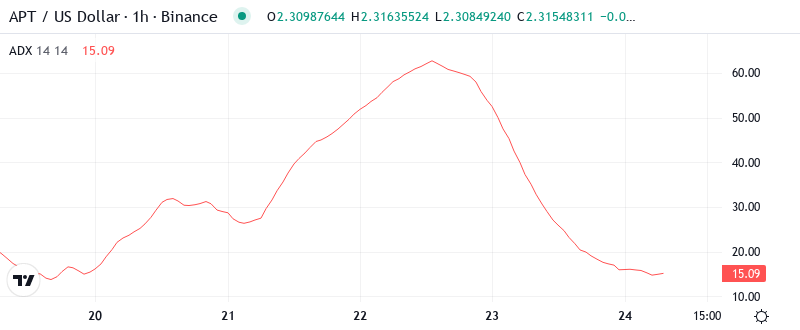
At the level of 39.51, the ADX entry indicates we’re witnessing one of the strongest trending moves in APT’s history – unfortunately for bulls, it’s pointing straight down. This reading sits well above the 25 threshold that separates ranging from trending markets, and approaching the 40+ zone that marks extreme directional conviction. Basically, the bears have complete control here, and the trend shows no signs of exhaustion despite the oversold extremes.
Unlike typical corrections where ADX might weaken as price falls, this indicator continues climbing – suggesting institutional-sized distribution rather than retail panic alone. Therefore, day traders should adapt their strategies to this powerful downtrend, favoring short-side setups on any bounce rather than trying to catch this falling knife. The combination of major ecosystem upgrades failing to attract buyers while ADX confirms trend strength paints a particularly bearish picture.
Price Trapped Below Entire EMA Ribbon Since November Breakdown
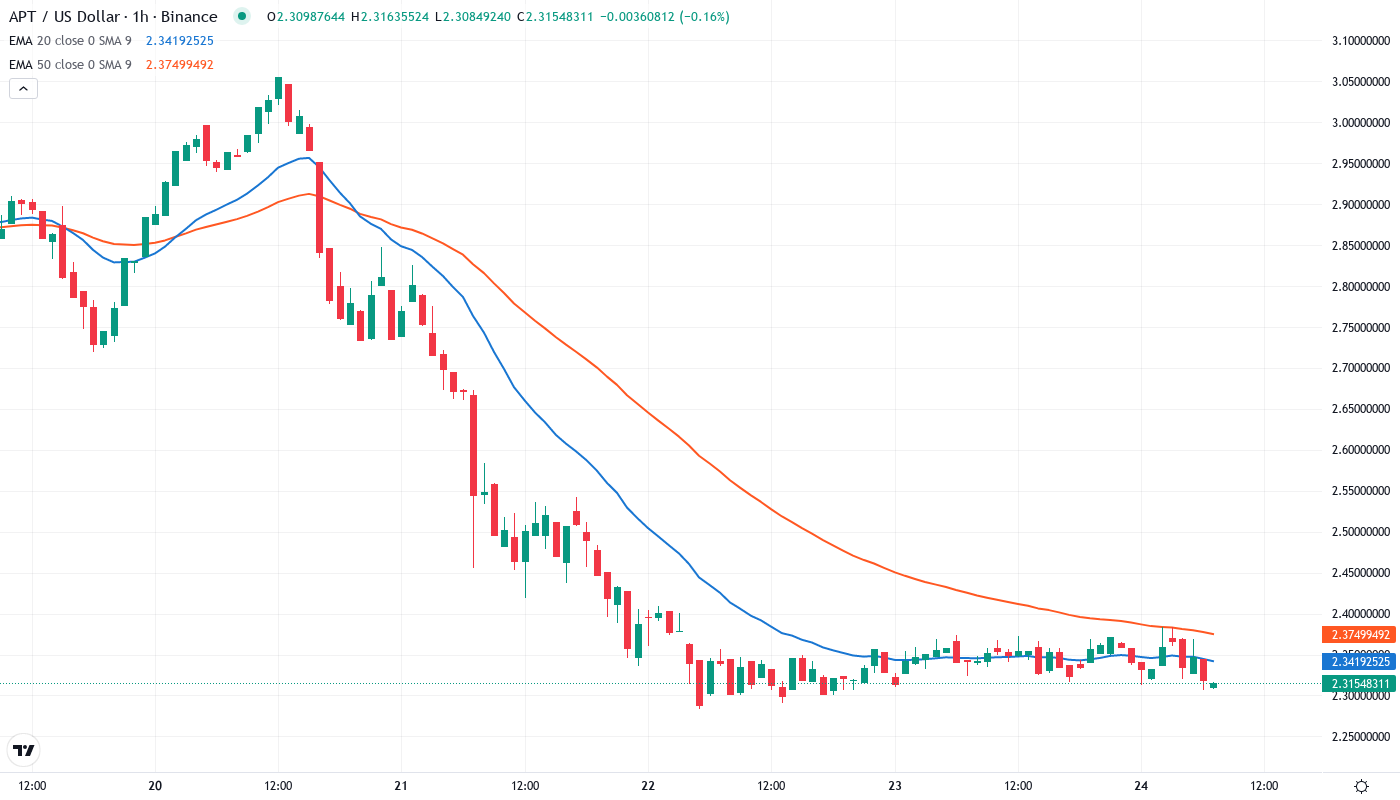
Price action tells a brutal story through the EMA structure, with APT trading beneath every single moving average from the 10-day ($2.59) all the way up to the 200-day (data not shown). Most critically, the 50-day EMA at $3.23 now sits nearly 40% above current price – a gap that illustrates just how violent this decline has been. Each attempted bounce has failed at progressively lower EMAs, with even the shortest-term 10-day average rejecting recovery attempts.
The 20-day EMA at $2.79 acted as a magnet for sellers during last week’s brief relief attempt, transforming what was support throughout October into insurmountable resistance. This complete breakdown of the moving average structure, combined with the failure of positive news flow to generate any sustainable bid, suggests APT needs significant time to rebuild any semblance of technical support. Even the USDG0 stablecoin launch on Aptos couldn’t pierce this dense resistance cloud overhead.
Bears Stack Resistance From $2.79 Through Monthly Pivot at $3.51
Above current price, sellers have fortified multiple resistance zones that would challenge any recovery attempt. The immediate ceiling sits at the 20-day EMA around $2.79, which has already proven its strength by rejecting last week’s bounce attempt. Beyond that, the psychological $3.00 level converges with the declining 30-day EMA, creating a formidable barrier that hasn’t been breached since late November’s breakdown. Support looks virtually non-existent after APT sliced through every technical level on its way down. The weekly low at $2.28 provides the only near-term floor, but with just three cents of cushion below current price, it’s hanging by a thread. Below that opens an air pocket to the yearly lows around $2.20, though even that level showed little buying interest during today’s test.
Monthly pivot calculations place major resistance at $3.51, roughly 50% above current levels – highlighting just how oversold this market has become. Yet the complete absence of buying interest despite major partnership announcements suggests the technical picture may need to deteriorate further before attracting value hunters. The market structure signals continued vulnerability as long as price remains pinned below $2.79.
Bulls Require Reclaim of $2.79 to Halt Multi-Month Bleeding
Bulls need a daily close above the 20-day EMA at $2.79 to even begin discussing a potential bottom, followed by volume-backed reclaim of the psychological $3.00 level. Only then could traders start eyeing the 50-day EMA at $3.23 as a realistic target, though even reaching that level would still leave APT down over 70% from yearly highs.
The bearish scenario accelerates if the $2.28 weekly low gives way on volume, which would likely trigger another leg down toward the $2.00 psychological level or beyond. Given that neither Chainlink integration nor stablecoin infrastructure developments could stem the selling, the technical breakdown appears to have momentum that overwhelms fundamental improvements.
With RSI at extreme oversold levels but ADX confirming powerful downtrend momentum, the most probable near-term path involves a weak relief bounce toward $2.50-$2.60 that fails at EMA resistance, followed by another test of the lows. Until APT can prove demand exists at these levels with a sustained move above $2.79, the technical picture remains decisively bearish despite the ecosystem progress.