Pi Network Darts 17% Higher as MiCA Compliance Opens European Gateway

Market Pulse
- Pi Network surged 17% this month following EU’s MiCA regulatory approval, marking its strongest regulatory milestone to date
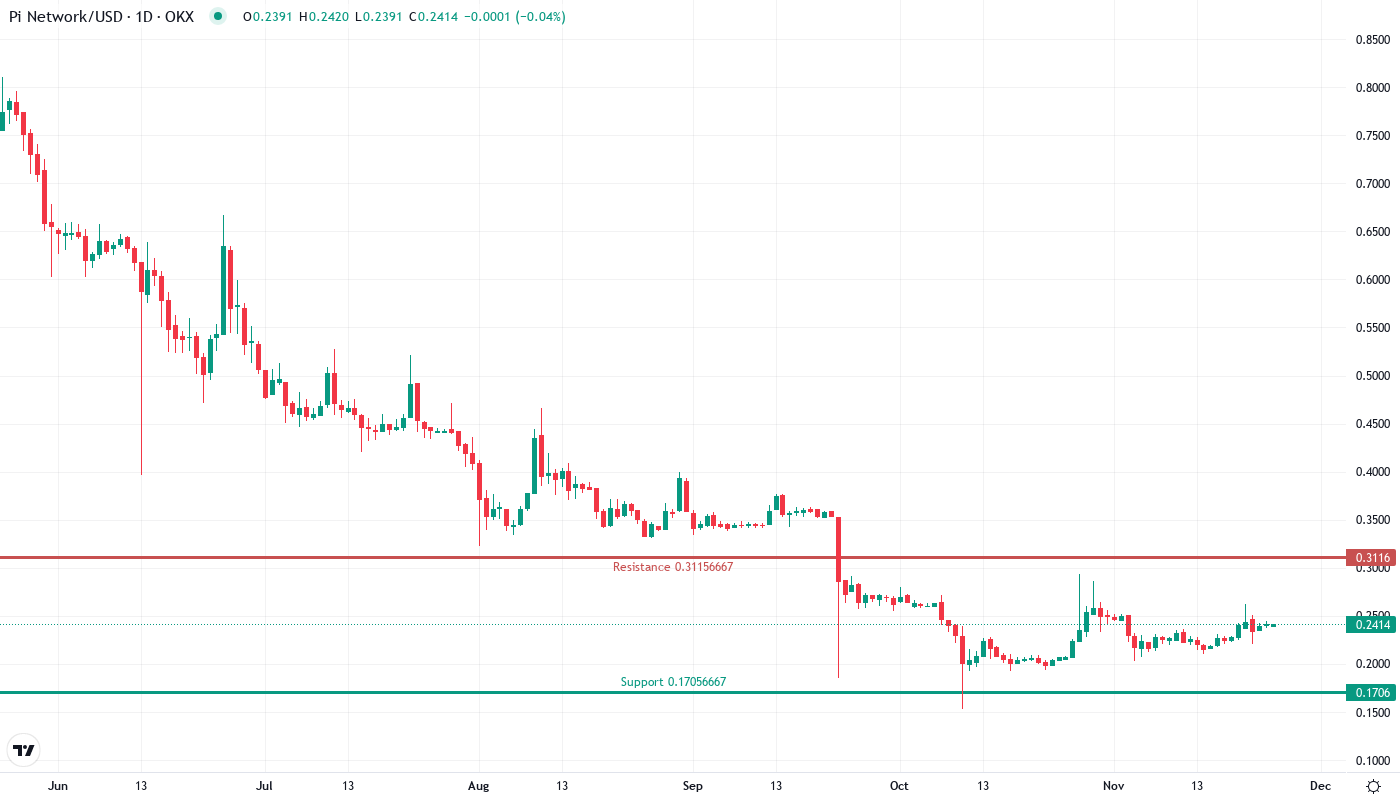
- Bulls reclaimed the critical $0.24 level after testing multi-month lows at $0.203, establishing a potential reversal base
- Technical indicators reset from oversold extremes while moving averages compress, setting up for directional expansion
Pi Network kicked off its most significant rally in months, climbing 17% over the past 30 days as the project secured full MiCA compliance – a regulatory achievement that transforms its European market prospects. The move higher follows a devastating 68% decline from six-month peaks, with price action now attempting to establish a bottom after touching $0.203 earlier this month. The main question for traders is: can this regulatory catalyst sustain momentum above newly reclaimed support, or will sellers defend overhead resistance zones that capped previous recovery attempts?
| Metric | Value |
|---|---|
| Asset | PI (PI) |
| Current Price | $0.24 |
| Weekly Performance | 5.72% |
| Monthly Performance | 16.89% |
| RSI (Relative Strength Index) | 55.2 |
| ADX (Average Directional Index) | 17.3 |
| MACD (MACD Level) | 0.00 |
| CCI (Commodity Channel Index, 20-period) | 111.28 |
RSI Climbs From Oversold Territory Following MiCA News Catalyst
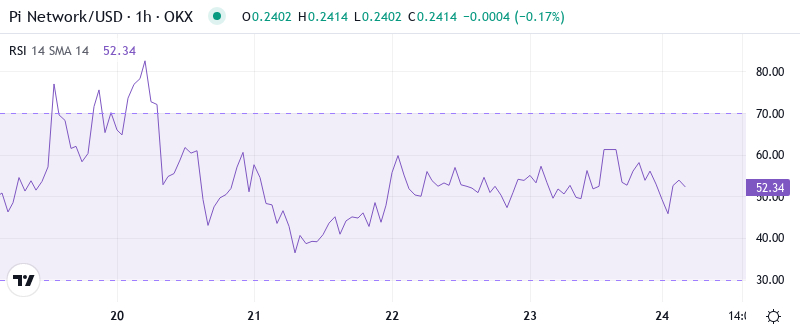
Reading the oscillator at 55.23 on the daily timeframe, Pi Network shows balanced momentum after climbing from deeply oversold conditions below 30. This neutral positioning leaves room for movement in either direction, with neither bulls nor bears holding a decisive edge. The recovery mirrors patterns seen in other altcoins following regulatory clarity – initial surges followed by consolidation as the market digests the implications.
What’s revealing is how RSI responded to the MiCA announcement, jumping from 31.87 on weekly timeframes to current levels in just days. Similar momentum resets in regulated crypto projects historically preceded 20-40% continuation moves, though Pi Network faces unique challenges given its unconventional distribution model. For swing traders, this balanced RSI configuration suggests waiting for a directional break above 60 or below 45 before committing to larger positions.
ADX at 17.26 Keeps Range Traders in Control Despite Regulatory Boost
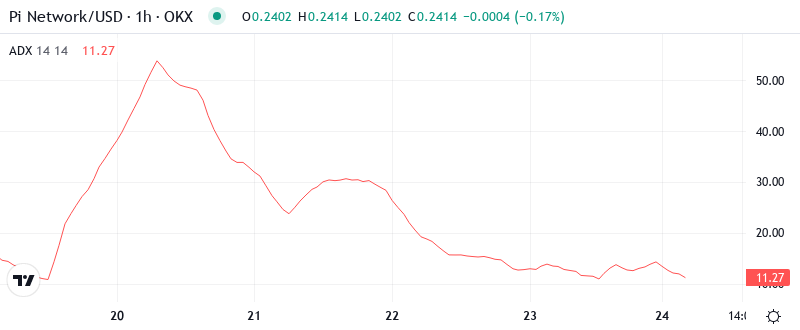
Trend strength remains notably weak with ADX reading just 17.26, indicating the MiCA-driven rally lacks the conviction typically seen in sustainable breakouts. At this level, the market favors range-bound action over trending conditions, despite the fundamental catalyst. Basically, traders should expect continued ping-pong action between support and resistance rather than a smooth directional move.
To clarify, the sub-20 ADX reading suggests most participants remain on the sidelines, waiting for clearer technical confirmation before chasing the regulatory narrative. This creates an environment where sharp moves in either direction quickly reverse, trapping breakout traders. Therefore, day traders should focus on mean reversion strategies near range extremes until ADX climbs above 25, signaling genuine trend emergence.
20-Day EMA at $0.232 Becomes First Major Test for Rally Continuation
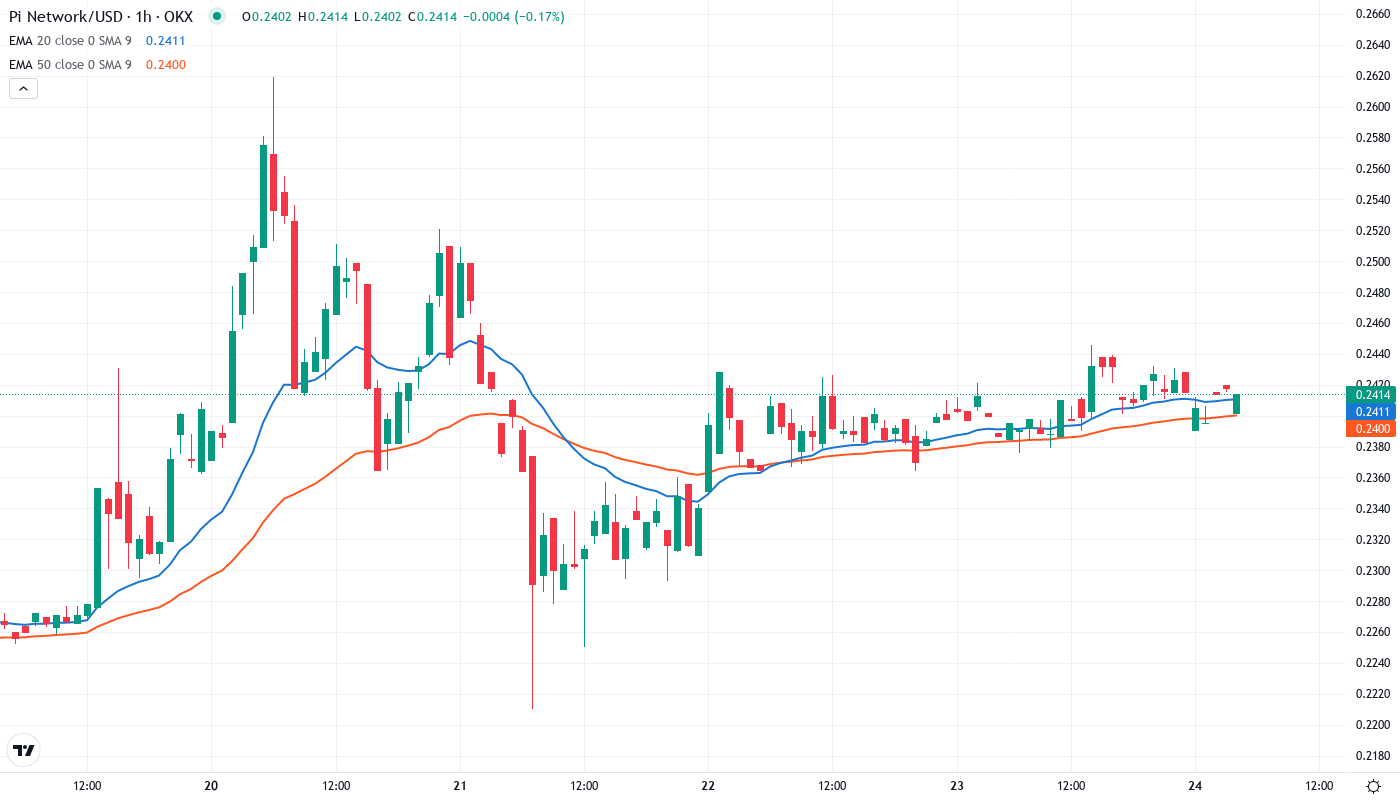
Price action pushed through initial resistance as Pi Network trades at $0.240, clearing the 10-day EMA at $0.235 on increased volume. More significantly, the approach toward the 20-day EMA at $0.232 sets up the first major technical test since the MiCA announcement. Bulls need to flip this level from resistance to support to validate the regulatory-driven recovery thesis.
Looking at the broader moving average structure, overhead resistance stacks heavy with the 30-day EMA at $0.242 and the 50-day at $0.295 – a full 23% above current levels. The compression between shorter-term averages suggests a resolution approaching, with the MiCA compliance potentially providing the fundamental backdrop for an upside break. That said, the significant gap to the 50-day EMA warns against expecting a straight-line recovery.
Resistance Wall Between $0.295 and $0.373 Caps Upside Potential
Sellers have fortified multiple resistance zones above current price, with the most immediate barrier sitting at the 50-day EMA near $0.295. This level rejected advances twice in recent months before the regulatory news arrived. Beyond that, the monthly pivot at $0.311 and psychological resistance at $0.373 create a formidable ceiling that would require sustained buying pressure to overcome.
On the downside, bulls now guard the $0.232 support that aligns with both the 20-day EMA and the recent breakout point. The critical floor remains at $0.203 – the monthly low that marked capitulation before the MiCA catalyst emerged. It is worth mentioning that volume picked up notably during the bounce from these lows, suggesting accumulation by traders positioning for the regulatory approval.
Market structure shifted constructive following the MiCA announcement, but the 68% drawdown from six-month highs left significant technical damage. The gap between current price at $0.240 and major resistance at $0.373 represents a 55% move – ambitious given the weak trend strength. This configuration resembles a bottoming pattern rather than the start of a new uptrend, requiring patience as the market builds a stronger foundation.
Bulls Need Sustained Close Above $0.295 to Confirm Regulatory Momentum
Should Pi Network reclaim and hold the 50-day EMA at $0.295 on a daily close, the technical picture brightens considerably. This would open a path toward the monthly pivot at $0.311, with the MiCA compliance providing fundamental support for continuation. Bulls require volume expansion above 10-day averages to validate such a breakout attempt.
The bearish scenario triggers if price fails at the 20-day EMA ($0.232) and drops back below $0.220 on volume. Such a rejection would trap recent MiCA-driven buyers and likely cascade toward a retest of $0.203 support. Loss of that level would negate the entire regulatory bounce and target the next support cluster near $0.170.
Given the weak ADX reading and heavy overhead resistance, the most probable near-term outcome sees Pi Network consolidating between $0.220 and $0.260 as the market digests the MiCA implications. This sideways grind would allow moving averages to flatten and ADX to reset, setting up a cleaner directional move once European exchange listings materialize.