CRO Plunges 24% as Trump Partnership Momentum Fades Into Oversold Territory
Market Pulse
- CRO tests multi-month lows at $0.108 after devastating monthly decline
- Trump Media partnership catalyst exhausted as sellers regain control
- Technical structure deteriorates with price trapped below entire EMA cloud
Cronos has tumbled 24.8% over the past month, erasing the entire Trump Media partnership rally and then some as CRO now trades at $0.108 – matching its weekly and monthly closing levels. The initial 11.5% surge following the Truth Social prediction market announcement proved fleeting, with sellers systematically unwinding positions as the hype dissipated. The main question for traders is: can the Smarturn upgrade and ecosystem developments provide a floor here, or will technical weakness drive further capitulation?
| Metric | Value |
|---|---|
| Asset | CRONOS (CRO) |
| Current Price | $0.11 |
| Weekly Performance | -6.05% |
| Monthly Performance | -24.76% |
| RSI (Relative Strength Index) | 39.3 |
| ADX (Average Directional Index) | 39.8 |
| MACD (MACD Level) | -0.01 |
| CCI (Commodity Channel Index, 20-period) | -72.13 |
RSI Drops to 39.29 – First Oversold Signal Since Summer Washout
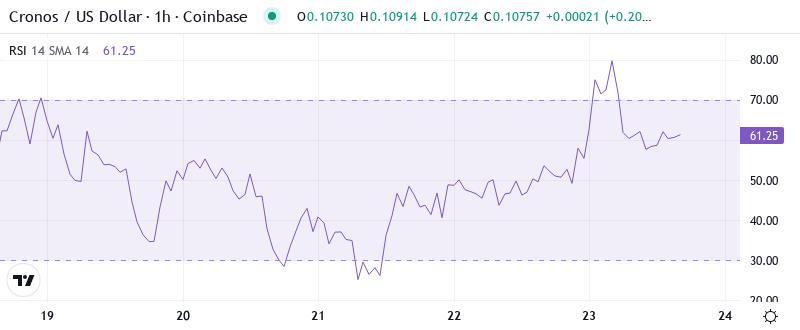
Reading the oscillator at 39.29, traders see the first genuinely oversold condition on CRO’s daily chart in months. This level historically marked turning points during the August and September corrections, where aggressive bounces followed similar momentum exhaustion.
The weekly RSI tells a more sobering story at 41.89, suggesting the longer timeframe remains far from capitulation territory despite the sharp monthly decline. What’s revealing is how RSI behaved during the Trump Media surge – it barely touched 60 before rolling over, never reaching the overbought extremes typical of sustainable rallies. So for swing traders, this oversold daily reading presents a potential bounce opportunity, but the lack of conviction during the recent pump warns against aggressive long positions until clearer reversal signals emerge.
ADX at 39.77 Confirms Mature Downtrend Nearing Exhaustion
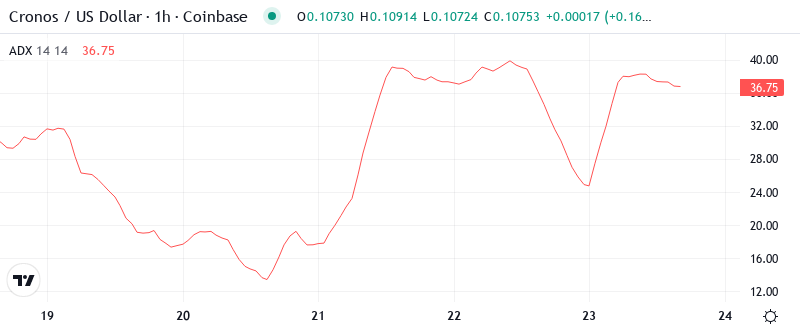
Trend strength readings paint a picture of conviction behind this month’s selloff, with ADX climbing to 39.77 – well into territory that typically precedes trend exhaustion. At this level, the ADX indicates we’re witnessing a powerful directional move that’s approaching its natural limits. Basically, when ADX pushes near 40, markets often pause to consolidate or reverse as the easy money has been made on the short side.
Looking at the ADX progression, it accelerated from the mid-20s during the Trump partnership announcement, signaling the shift from consolidation to trending conditions. To clarify, this high ADX reading suggests day traders should prepare for potential volatility expansion as the trend either climaxes with a final flush or transitions into a relief bounce phase.
Price Trapped Below Entire EMA Ribbon Since Partnership Rally Failed
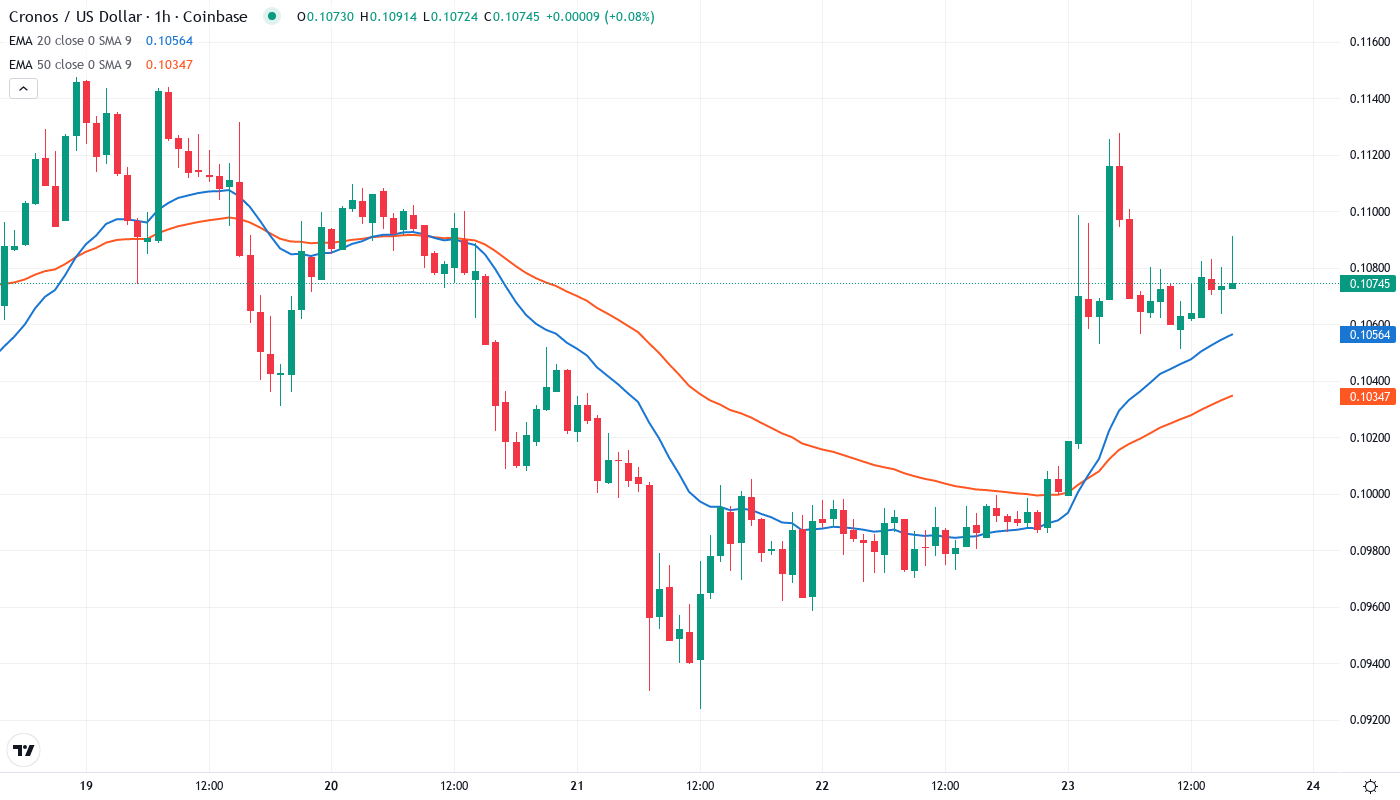
The moving average structure reveals just how decisively bears have taken control. CRO currently trades below all major EMAs – the 10-day ($0.117), 20-day ($0.139), 50-day ($0.140), and crucially the 100-day at $0.152. This complete breakdown of moving average support occurred as the Truth Social momentum faded, with each EMA flipping from support to resistance in succession.
Most telling is the compression between the 20-day and 50-day EMAs around $0.139-0.140, which now forms a formidable resistance cluster. The 200-day EMA sits distant at $0.147, offering no immediate support as price explores these multi-month lows. That former support zone between $0.139-0.140 transforms into the first major hurdle bulls must clear to even begin discussing trend reversal.
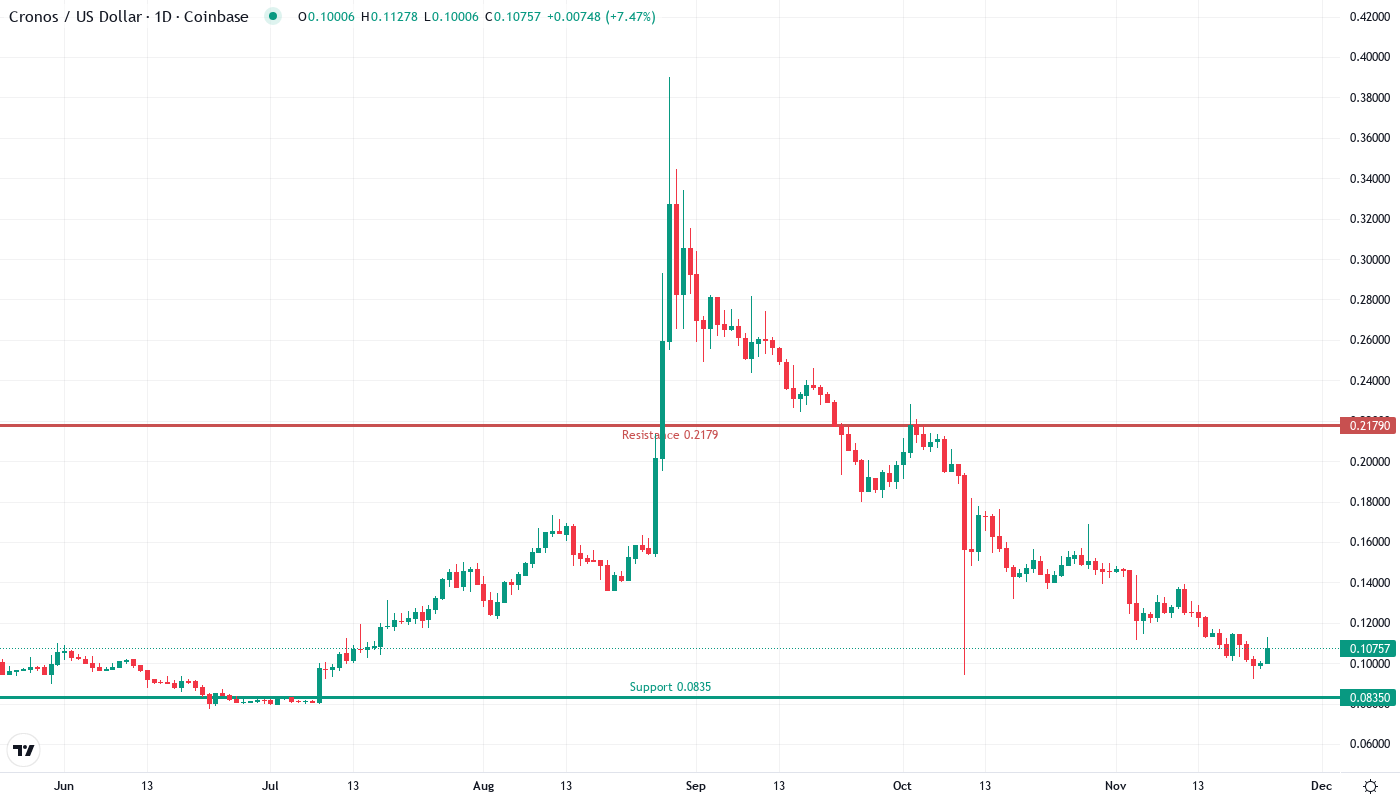
Support Architecture Crumbles as $0.108 Becomes Last Defense
Above current levels, resistance stacks heavy with the monthly pivot at $0.156 aligning perfectly with the 100-day EMA – a double barrier that rejected recovery attempts twice this week. The psychological $0.15 level just below adds another layer to this resistance sandwich, making any sustained move above $0.156 unlikely without significant catalyst support from the Smarturn upgrade implementation or renewed partnership momentum.
Bulls defend their final stronghold at the current $0.108 level, which represents both the weekly and monthly close. This price point has attracted buyers three times in the past 48 hours, suggesting some conviction among dip-buyers betting on the oversold bounce thesis. Below here, the next meaningful support doesn’t emerge until $0.083 – the monthly S1 pivot that would represent another 23% decline from current levels.
Bulls Need Decisive Close Above $0.140 to Shift Momentum
Should CRO mount a recovery, bulls require a daily close above the compressed EMA resistance at $0.140 with accompanying volume to confirm exhaustion of the selling pressure. The Smarturn upgrade rollout and continued Truth Social integration could provide the fundamental catalysts needed, but price must first prove demand exists at these oversold levels by defending $0.108 through the weekly close.
The bearish scenario triggers if $0.108 support breaks on volume, opening a direct path to $0.083 where monthly pivot support waits. This would trap recent dip-buyers who entered on the oversold RSI signal and likely cascade into forced liquidations as the Trump partnership narrative completely unwinds. A weekly close below $0.108 essentially confirms continuation of the monthly downtrend.
Given the oversold daily conditions meeting strong trending behavior on higher timeframes, the most probable near-term path sees CRO attempting a relief bounce toward $0.125-0.130 before sellers reemerge at the 10-day EMA. Without fresh fundamental catalysts beyond the current development pipeline, technical weakness dominates until proven otherwise.