Mantle Tests Critical Support at $0.98 as Institutional Partnerships Fail to Stem 38% Monthly Decline
Market Structure Shifts Lower
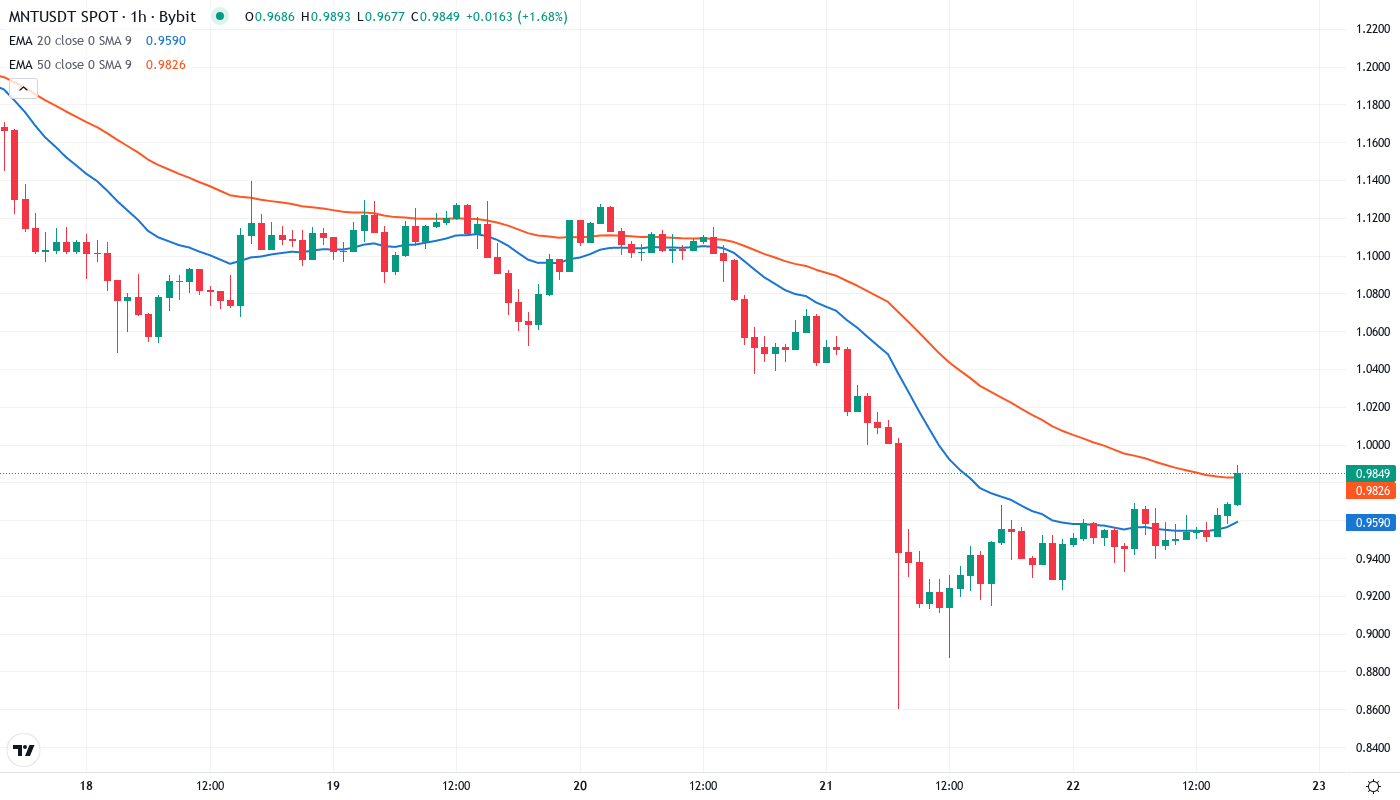
- MNT hovers at $0.9854, down 38.2% from monthly highs despite major institutional announcements
- ADX at 29.24 signals genuine downtrend momentum building after support failures
- Bulls defend the psychological $1.00 level but face stacked resistance from $1.10 to $1.40
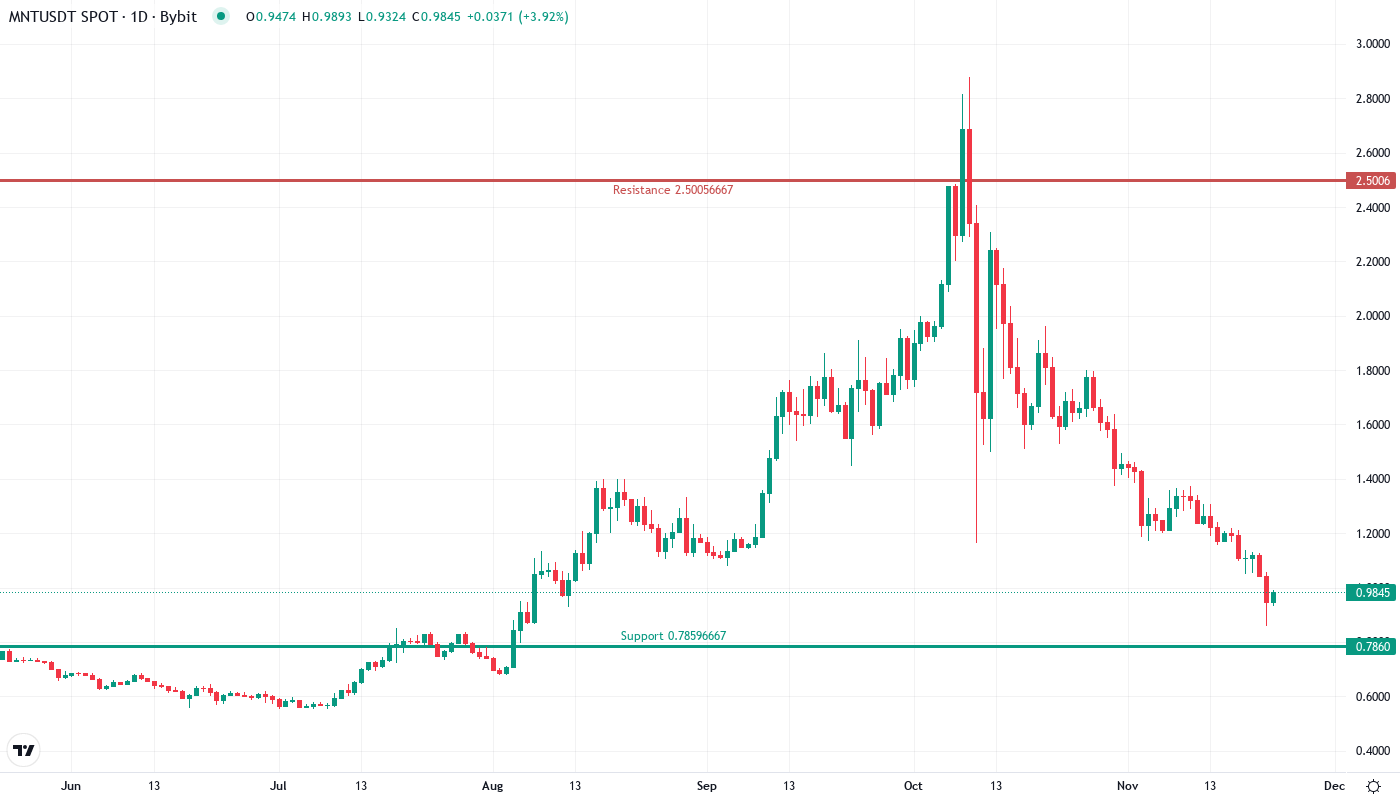
Mantle has shed over a third of its value in the past month, tumbling from highs near $1.80 to current levels at $0.9854 – a devastating drop that institutional partnerships with Anchorage Digital and DFSA-approved tokenized fund launches couldn’t arrest. The 38.21% monthly decline accelerated despite Chainlink integration news that would typically provide wind to the sails, suggesting deeper structural issues overwhelm positive fundamentals. The main question for traders is: can bulls defend the psychological $1.00 level, or will the breakdown continue toward August lows near $0.86?
| Metric | Value |
|---|---|
| Asset | MANTLE (MNT) |
| Current Price | $0.99 |
| Weekly Performance | -15.84% |
| Monthly Performance | -38.21% |
| RSI (Relative Strength Index) | 31.4 |
| ADX (Average Directional Index) | 29.2 |
| MACD (MACD Level) | -0.14 |
| CCI (Commodity Channel Index, 20-period) | -174.54 |
RSI at 31.40 Approaches Oversold Territory – Matches October Capitulation Levels
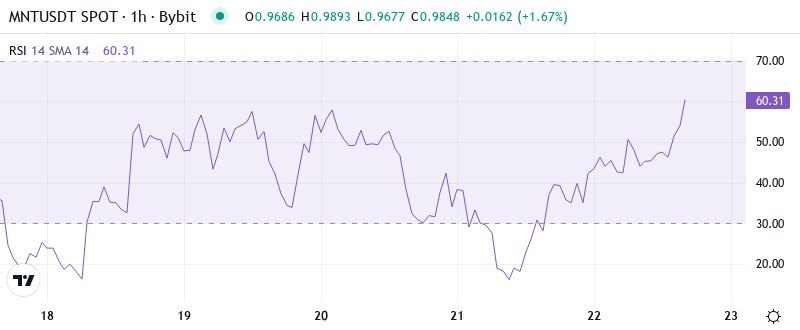
Reading the oscillator at 31.40, traders see momentum exhaustion approaching levels last witnessed during October’s washout that preceded a 40% relief rally. The daily RSI hasn’t touched the extreme oversold zone below 30 yet, leaving room for additional downside before mean reversion kicks in. Historically, MNT has bounced sharply from RSI readings between 28-32, though the current fundamental backdrop with multiple institutional integrations failing to support price action suggests this time might differ.
What’s revealing is how RSI barely budged despite the Chainlink Data Streams announcement and DFSA-approved fund launch – typically bullish catalysts that should spark momentum shifts. So for swing traders, this muted oscillator response to positive news flow signals persistent selling pressure that hasn’t fully exhausted itself, making knife-catching attempts particularly risky until RSI confirms a reversal with positive divergence.
ADX Climbs to 29.24 – Downtrend Gains Conviction Despite Institutional Backing
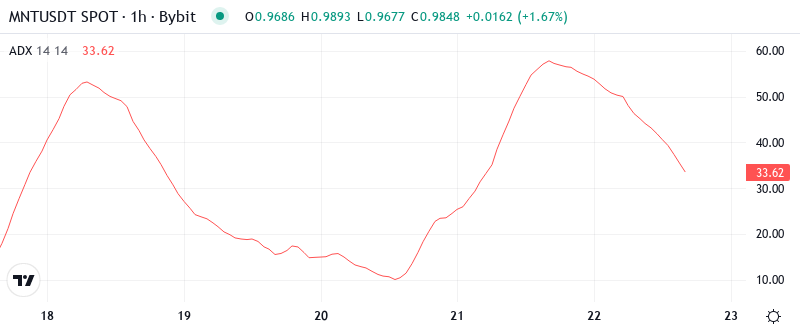
Trend strength readings paint a clear picture with ADX climbing to 29.24, marking the shift from November’s choppy consolidation into directional movement – unfortunately for bulls, that direction is decisively down. The indicator crossed above 25 just as MNT broke below the $1.20 support zone, and its continued ascent toward 30 signals sellers maintain control despite Anchorage Digital custody news that should theoretically attract institutional flows.
To clarify, the ADX is indicating that we’ve transitioned from range-bound conditions where mean reversion strategies worked into a trending environment where momentum follows through. Therefore, day traders should adapt their strategies to this regime change – fading bounces rather than buying dips until ADX peaks and rolls over, signaling trend exhaustion. The fact that trend strength intensifies while major partnerships get announced reveals how overwhelmed buyers are by broader market dynamics.
20-Day EMA at $1.21 Now Acts as Dynamic Resistance After December Breakdown
Price action tells a stark story through the EMA ribbons, with MNT trading below every significant moving average – the 10-day ($1.10), 20-day ($1.21), 50-day ($1.29), and distant 100-day EMA at $1.39. This complete bearish alignment formed after price convincingly broke below the 50-day EMA in early December, transforming what had been reliable support during the October-November consolidation into overhead resistance that capped every relief attempt since.
Most significant is the compression between current price at $0.9854 and the nearest EMA resistance at $1.10 – roughly 11% overhead supply that bulls must absorb before even attempting to reclaim trend structure. The 50-day EMA at $1.29, which rejected advances three times in December despite positive news flow including the DMZ Finance tokenized fund launch, now represents the key level bulls must reclaim to shift the narrative from “bearish trend intact” to “potential reversal building.”
Resistance Clusters Between $1.10 and $1.40 While Bulls Guard Final Support at $0.98
Above current levels, sellers have fortified multiple resistance zones starting with the immediate barrier at $1.10 where the 10-day EMA converges with psychological round numbers. The more formidable wall sits between $1.20-1.29, encompassing the 20-day EMA, previous support-turned-resistance, and the monthly pivot point – a confluence zone that’s already proven its strength by rejecting recovery attempts even as Mantle announced game-changing institutional infrastructure.
Bulls currently defend their last stand at $0.98, just above the psychological $1.00 level and monthly lows at $0.86. This support has attracted buyers six times over the past week, though each bounce grows weaker – a pattern suggesting exhaustion rather than accumulation. The fact that major partnership announcements couldn’t lift price above even the first resistance layer reveals how technically damaged the structure has become.
Market architecture shows clear distribution patterns with lower highs at $1.80, $1.42, and $1.21 forming a descending channel. Until bulls can reclaim and hold above $1.29 (the 50-day EMA), the path of least resistance remains lower toward the August support cluster between $0.86-0.80, regardless of fundamental developments that would typically spark rallies in healthier technical setups.
Bulls Need Daily Close Above $1.10 to Halt Bleeding Despite Institutional Tailwinds
Should MNT reclaim the 10-day EMA at $1.10 with conviction, the initial relief target sits at $1.21-1.29 where multiple resistance factors converge. Bulls require sustained buying pressure and ideally another major catalyst beyond the recent Chainlink and Anchorage partnerships to break through this supply zone and target the gap fill at $1.40.
The bearish scenario triggers if $0.98 support caves on volume, opening an air pocket to monthly lows at $0.86 and potentially the August washout zone near $0.80. A breakdown below the psychological $1.00 level would likely flush leveraged positions and create the final capitulation spike that often marks intermediate bottoms – though catching that falling knife requires precise timing.
Given the technical damage and inability of bullish fundamentals to arrest the decline, the most probable near-term path sees MNT grinding between $0.95-1.05 as bulls and bears battle for control of the key $1.00 level. Without a significant new catalyst or broader crypto market recovery, the institutional developments already announced appear insufficient to overcome the dominant downtrend structure.