Ethereum Classic Darts Below $14 as Technical Indicators Flash Oversold Extremes

Market Structure Shifts Lower
- ETC tumbled 15.5% in the past month, erasing summer recovery gains
- Oversold signals emerge across multiple timeframes for first time since June
- Support at $12.59 marks critical defense line after six-month decline

Ethereum Classic has shed nearly half its value over the past six months, with the recent slide accelerating as ETC dropped 15.5% in the past month alone to trade at $13.27. The cryptocurrency now sits precariously close to its monthly low of $12.59, having fallen from highs near $19 just weeks ago. The main question for traders is: does this oversold bounce represent a buying opportunity, or will the bearish momentum continue as broader market comparisons highlight ETC’s lagging transaction volume relative to newer networks?
| Metric | Value |
|---|---|
| Asset | ETHEREUM CLASSIC (ETC) |
| Current Price | $13.27 |
| Weekly Performance | -11.91% |
| Monthly Performance | -15.47% |
| RSI (Relative Strength Index) | 36.4 |
| ADX (Average Directional Index) | 20.8 |
| MACD (MACD Level) | -0.67 |
| CCI (Commodity Channel Index, 20-period) | -151.67 |
RSI Plunges to 36.36 – Deepest Oversold Territory Since June Capitulation

Reading the oscillator at 36.36, traders see momentum has shifted decisively bearish, with ETC now trading in oversold conditions that typically mark either capitulation phases or bounce setups. This marks the first time since June’s washout that daily RSI has dipped below the crucial 40 threshold – a level that historically has coincided with at least temporary relief rallies in ETC’s price action.
What’s revealing is how the weekly RSI at 36.04 confirms the oversold condition isn’t just a short-term aberration but reflects genuine selling pressure across multiple timeframes. So for swing traders, this confluence of oversold readings suggests we’re approaching levels where contrarian buyers often emerge, though catching this particular falling knife requires careful risk management given the 45.8% drawdown over three months.
ADX at 20.77 Signals Weak Trend as Sellers Lose Steam
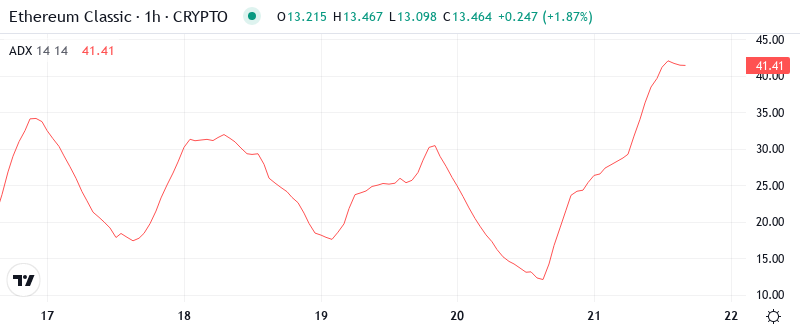
At the level of 20.77, the ADX entry indicates that while the downtrend has been persistent, it lacks the explosive momentum typically seen in panic selloffs. Basically, being in this zone below 25 suggests ETC is transitioning from trending to ranging conditions – a shift that often precedes consolidation periods rather than continued directional moves.
Historically, such compressions in trend strength after extended declines have provided better risk-reward setups for patient traders. Therefore, day traders should adjust their strategies from trend-following to range-trading tactics, focusing on support and resistance levels rather than momentum breakouts until ADX climbs back above 25 to signal renewed directional conviction.
Moving Averages Paint Grim Picture as Price Trades Below Entire EMA Ribbon
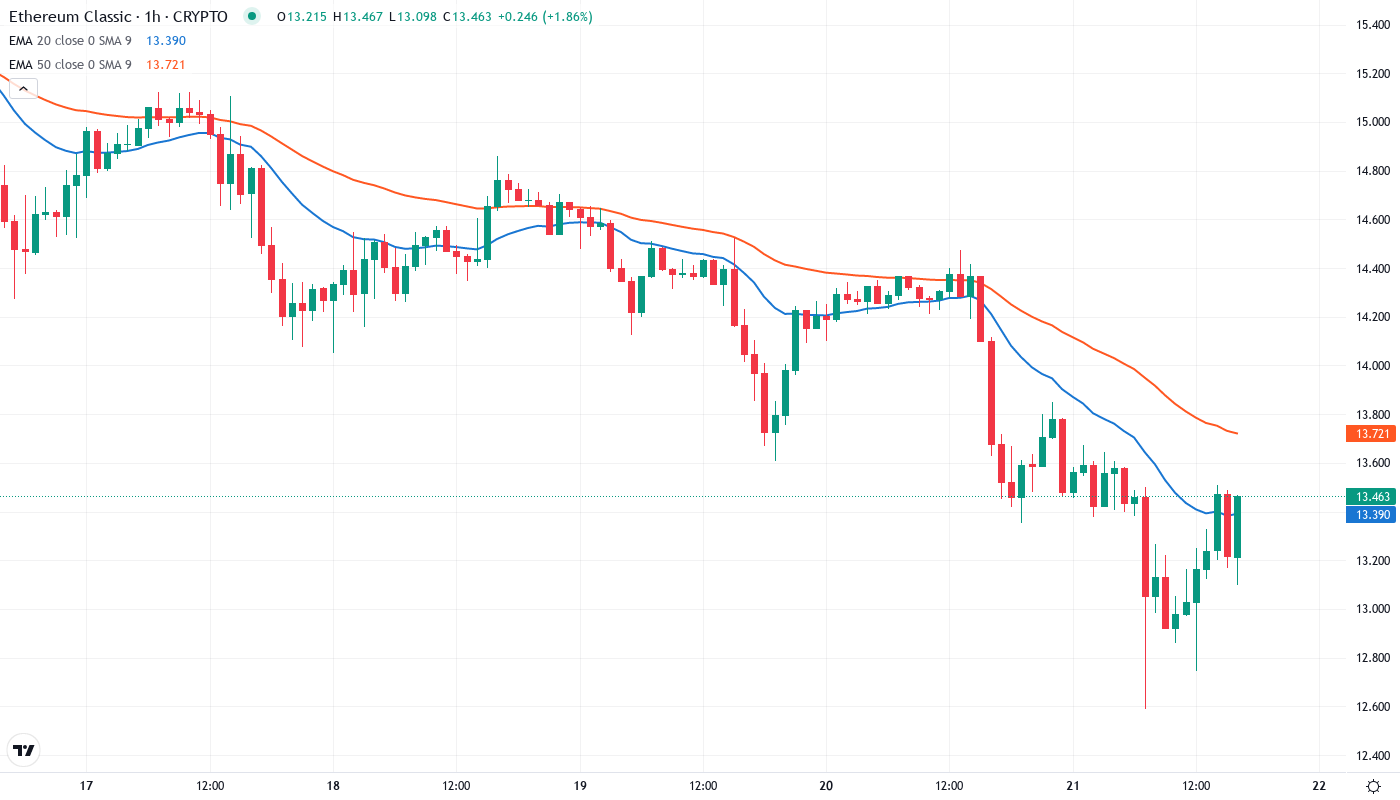
Price action tells a devastating story through the EMA structure, with ETC trading below every major moving average from the 10-day ($14.39) all the way up to the 200-week level. The 50-day EMA at $16.14 now acts as formidable overhead resistance – roughly 21% above current prices – illustrating just how far ETC has fallen from its intermediate trend.
More concerning for bulls is how the 20-day EMA at $14.95 rejected recent bounce attempts, confirming that what was once reliable support during the summer rally has flipped to resistance. This complete breakdown of the moving average structure means any sustainable recovery requires not just a bounce but a systematic reclaim of these levels, starting with the nearby 10-day EMA at $14.39.
Monthly Low at $12.59 Becomes Make-or-Break Support Zone
The immediate resistance stacks between $14.39 (10-day EMA) and $14.95 (20-day EMA), creating a narrow band where sellers have already shown their hand by defending aggressively. Above that, the psychological $15 level aligns with the 30-day EMA at $15.37, forming a triple confluence of resistance that would require significant buying pressure to overcome.
Bulls now guard the monthly low at $12.59 as their final stand, with any decisive break below targeting the yearly low near $11.68 – a level not seen since last winter’s crypto-wide capitulation. It is worth mentioning that ETC has already tested the $12.50-$13 zone multiple times this year, suggesting this area holds psychological importance for longer-term holders.
Current price architecture reveals a market trapped in a descending channel, with lower highs and lower lows dominating the structure since summer. The lack of any meaningful support until $11.68 creates an air pocket below that could accelerate losses if $12.59 fails to hold on any retest with volume.
Bulls Need Reclaim Above $14.95 to Shift Momentum
Should ETC manage to close above the 20-day EMA at $14.95, it would mark the first positive structural development in weeks and potentially trigger short covering toward the 50-day EMA at $16.14. The oversold bounce scenario gains credibility if accompanied by rising ADX above 25, confirming that buyers are stepping in with conviction rather than just bottom-fishing.
The bearish scenario activates if price loses $12.59 support on a daily close, which would likely flush positions down to $11.68 or potentially into single digits for the first time since 2020. This outcome becomes increasingly probable if Bitcoin continues sliding and broader risk-off sentiment persists, especially given ETC’s underperformance relative to other layer-1 protocols.
Given the deeply oversold conditions across multiple timeframes and proximity to multi-month support, the most likely near-term path sees ETC attempting a relief bounce toward $14.50-$15 resistance before the larger trend reasserts itself. However, any sustainable recovery requires addressing the fundamental concerns about transaction volume and network utility that recent comparisons to newer chains have highlighted.