Litecoin Tests Critical Support at $92 as Hashrate Surges 117%
Market Structure Shifts Higher
- LTC hovers at $92.33, down 20% monthly but showing signs of stabilization
- Network hashrate jumps 117%, signaling miner confidence despite price weakness
- Technical indicators suggest consolidation phase before next directional move
Litecoin trades at $92.33 after a devastating monthly drop of 19.7% that erased gains from the summer rally. The 117% hashrate surge creates an interesting divergence – miners are doubling down on network security even as price action remains weak, suggesting potential undervaluation based on fundamentals. The main question for traders is: will this technical bounce from $80 support hold, or are we seeing a dead cat bounce before another leg down?
| Metric | Value |
|---|---|
| Asset | LITECOIN (LTC) |
| Current Price | $92.33 |
| Weekly Performance | -5.50% |
| Monthly Performance | -1.89% |
| RSI (Relative Strength Index) | 44.9 |
| ADX (Average Directional Index) | 15.1 |
| MACD (MACD Level) | -1.25 |
| CCI (Commodity Channel Index, 20-period) | -54.03 |
RSI at 44.6 Signals Neither Bulls Nor Bears Control
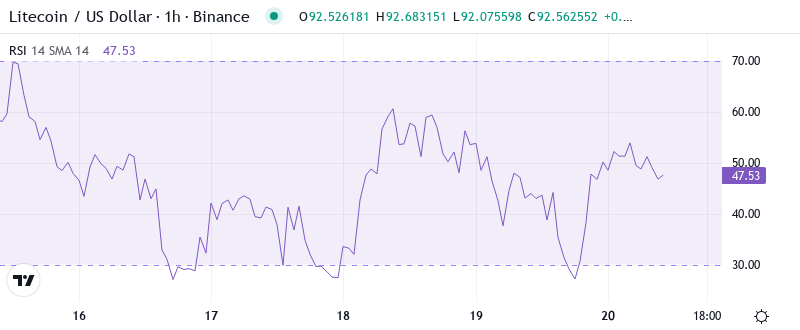
Reading the oscillator at 44.6, traders see a market in perfect equilibrium after bouncing from oversold territory. This neutral positioning follows a sharp recovery from the 31.0 reading on the weekly timeframe, where LTC found buyers stepping in aggressively. Similar RSI configurations in September preceded multi-week consolidation phases that eventually resolved higher.
So for swing traders, this balanced RSI means patience is key – the market lacks directional conviction despite the impressive hashrate growth providing fundamental support. The monthly RSI at 49.9 confirms this neutrality extends across timeframes, suggesting neither exhaustion nor euphoria dominates sentiment currently.
ADX Below 20 Keeps Range Traders in Control
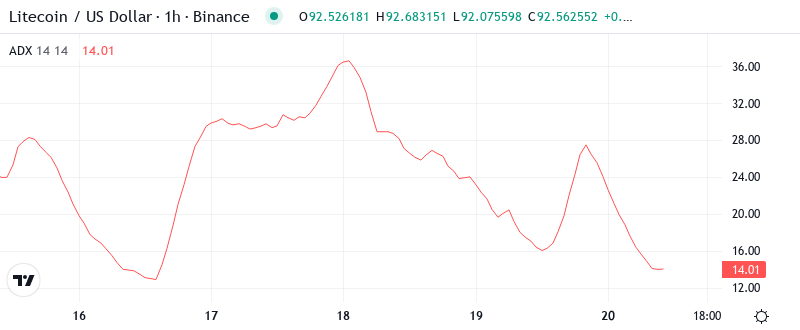
Trend strength remains anemic with ADX crawling at 15.1, well below the 25 threshold that signals trending conditions. Basically, we’re stuck in choppy waters where range-bound strategies outperform trend-following approaches. The combination of weak ADX and neutral RSI paints a picture of compression – like a coiled spring waiting for a catalyst.
To clarify, the ADX is indicating that despite the 117% hashrate surge creating bullish fundamental backdrop, price action remains trapped in consolidation mode. Therefore, day traders should focus on playing the range between $80 support and $105 resistance rather than positioning for breakouts until ADX climbs above 25.
50-Day EMA at $95.14 Becomes First Hurdle for Bulls
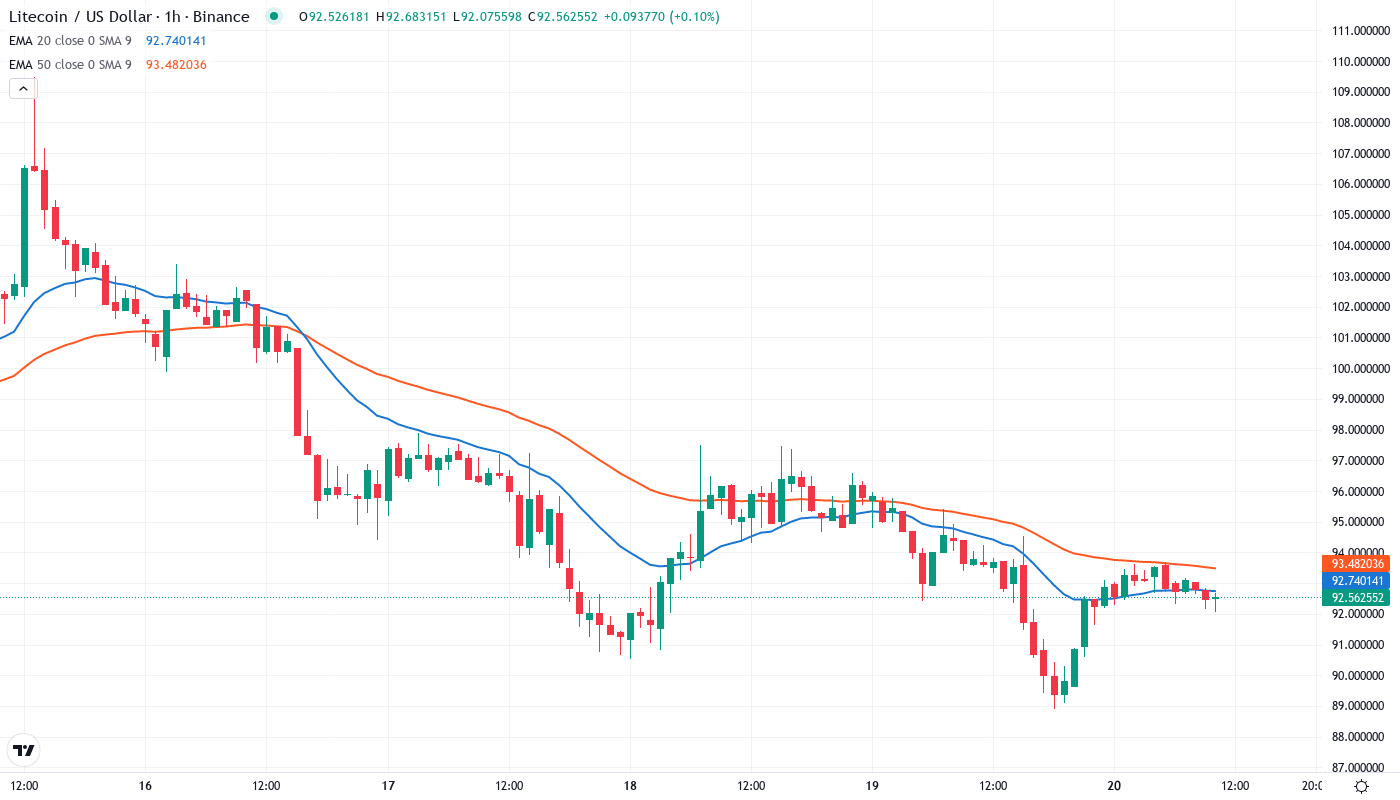
Price action tells a clear story through the EMA structure. LTC currently trades below the crucial 50-day EMA at $95.14, which rejected advances twice in the past week. More concerning for bulls, the 100-day EMA looms overhead at $99.52, creating a resistance cluster between $95-$100 that coincides with psychological round numbers.
What’s revealing is how the 20-day EMA at $96.57 aligns perfectly with the 50-day, forming a confluence zone that bulls must reclaim to shift momentum. The 200-day EMA sits distant at $102.18, but that former support area now transforms into a red line that would confirm a larger trend reversal if reclaimed on volume.
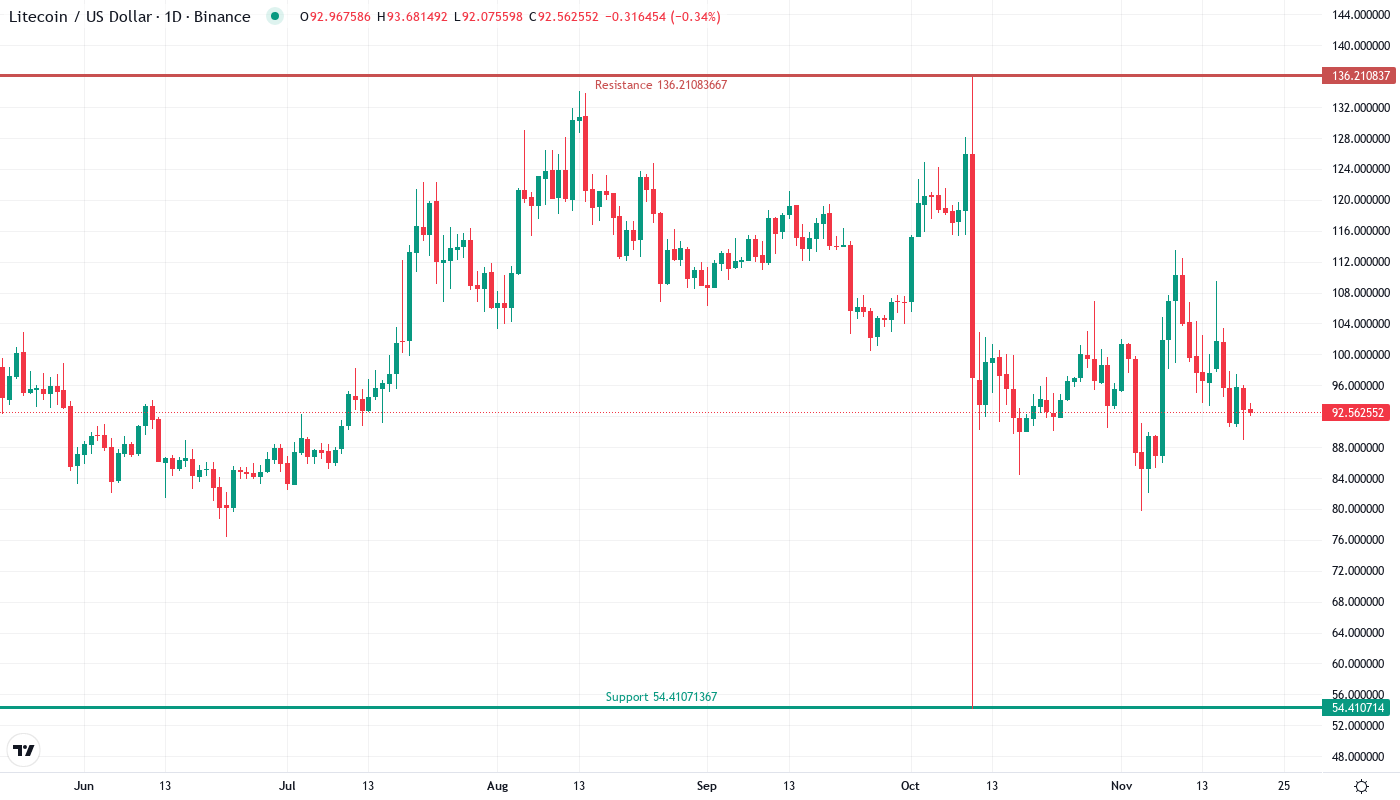
Support Architecture Builds From $80 to $92
Above current price, sellers have stacked multiple resistance layers between $95.14 (50-day EMA) and the monthly high at $113.52. The immediate resistance zone from $95-$100 combines moving average confluence with the psychological $100 level, creating a formidable barrier that rejected price action three times since December began.
Bulls defend a more comprehensive support structure thanks to the recent bounce from $79.76. The $92 level where LTC currently trades represents the first line of defense, with stronger support at the monthly low near $80. This $80 floor has held six times over the past three months, gaining significance with each successful test.
Crucially, the market structure shows buyers emerging whenever price approaches the $80-$85 zone, despite broader crypto market weakness. The 117% hashrate increase reinforces this support level – miners wouldn’t be expanding operations if they expected a breakdown below these levels.
Consolidation Between $80-$100 Most Probable Near Term
Bulls require a decisive close above the 50-day EMA at $95.14 to kickstart recovery momentum toward $100. The hashrate surge provides fundamental fuel, but technical resistance remains heavy until price reclaims that crucial moving average cluster on sustained volume.
The setup fails if LTC loses $80 support on a daily close – such a breakdown would trap recent buyers and likely trigger stops toward $70. With the network fundamentals strengthening dramatically, this bearish scenario seems less probable unless broader crypto markets crater.
Given the technical configuration and hashrate divergence, the most likely path sees LTC grinding between $80-$100 while building energy for the next directional move. The improving network security metrics suggest accumulation is occurring despite tepid price action.