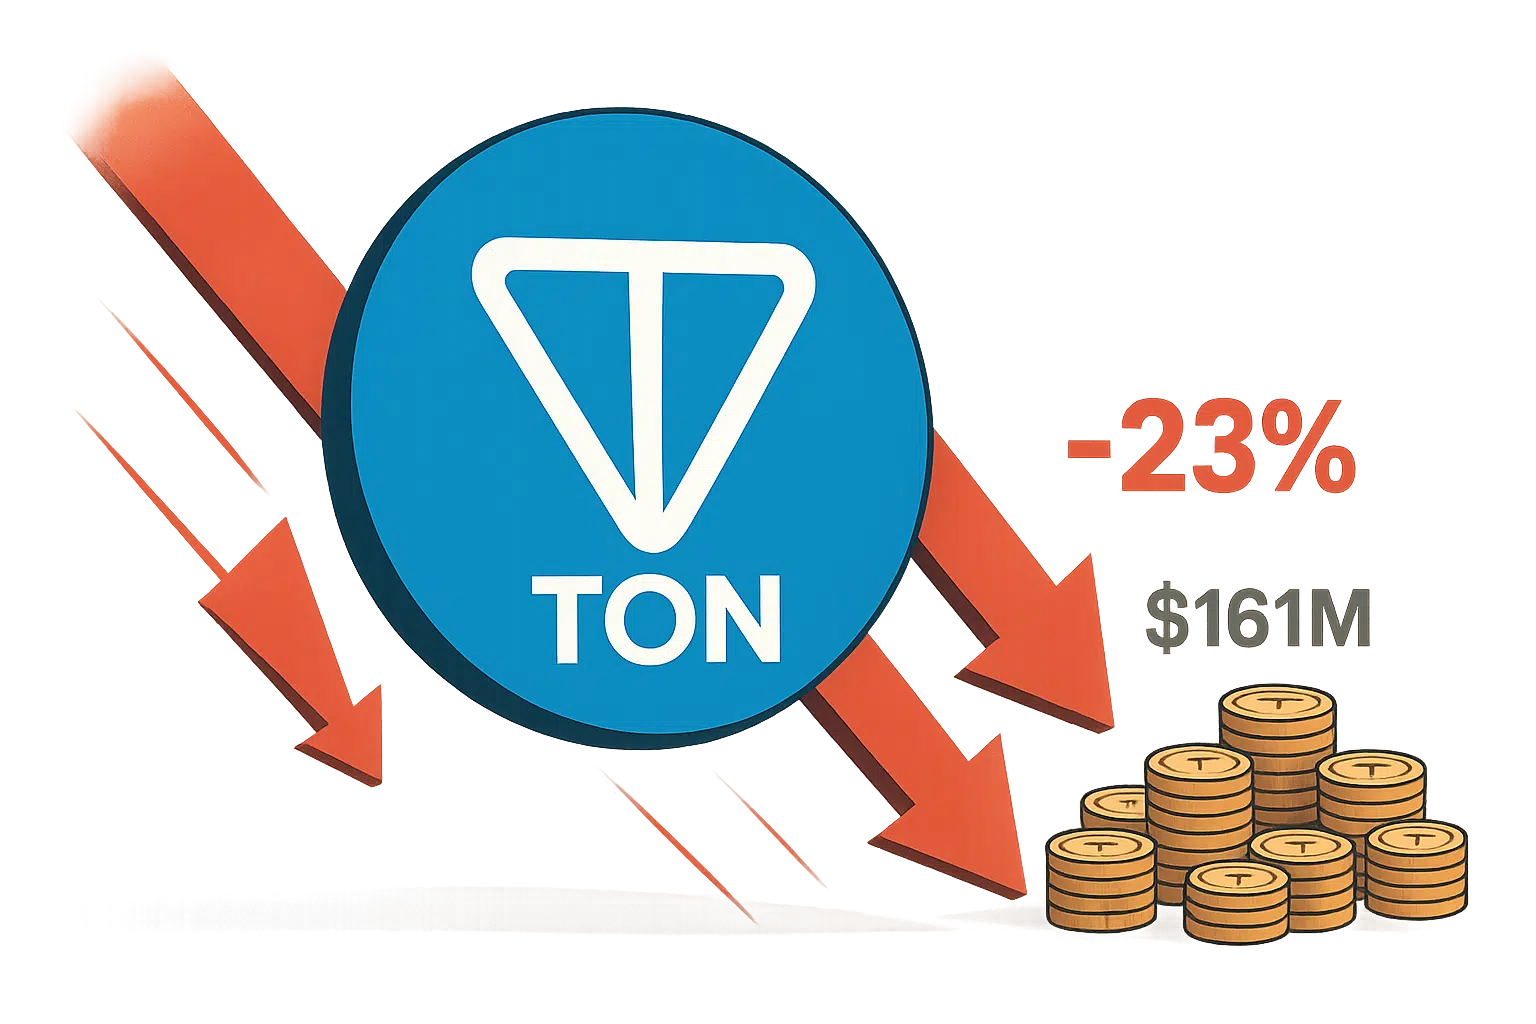
Toncoin Plunges 23% as $161M Token Unlock Looms Despite Coinbase Roadmap Boost
Market Pulse
- TON plummeted to $1.71 on Oct. 17, down 12.6% in 24 hours and 23.1% over the last 30 days.
- Late September crash saw prices drop by more than 40% in less than a week.
- Despite two pieces of positive news, selling continues ahead of a $161M token unlock.
TON plummeted to $1.71 on Oct. 17, after shedding 12.6% of its value over 24 hours and collapsing 23.1% over the previous 30 days. The token’s poor performance comes after a late September crash saw prices drop by more than 40% in less than a week. Despite two significant pieces of good news in the past week, the bleeding has continued, and there is a massive $161M unlock scheduled this week.
The recent Toncoin price action has been heavily influenced by the impending unlock of 100 million tokens – which were distributed to the project’s developer, investors, and foundation – in the TIP-3 blockchain standard. The unlock schedule got off to a bad start last month when the first batch of unlocked tokens caused a sizeable sell‐off. It’s now estimated the market will have to absorb roughly 41.5 million more tokens over the next fortnight.
Unlock worries are legitimate. The previous 100 token unlock was spread over a longer period, so the impact was more digestible for the market. Deribit’s one-week 45% implied volatility for Toncoin options underscores how choppy the road ahead might be. The strike skew indicates the market appears more worried about the downside risks. The one-week at-the-money-Toncoin straddle premium is multiple points lower than Skew’s 14-day variance swap. This suggests the options market is underpricing the potential for a further Toncoin price drop. The original oscillator continues to float well below the previous lows. This entire set-up leans bearish.
| Metric | Value |
|---|---|
| Asset | TONCOIN (TON) |
| Current Price | $1.71 |
| Weekly Performance | -14.93% |
| Monthly Performance | -23.57% |
| RSI (Relative Strength Index) | 30.3 |
| ADX (Average Directional Index) | 51.6 |
| MACD (MACD Level) | -0.14 |
| CCI (Commodity Channel Index, 20-period) | -118.80 |
RSI at 30.3 Signals Deep Oversold Territory – Matches Summer Capitulation
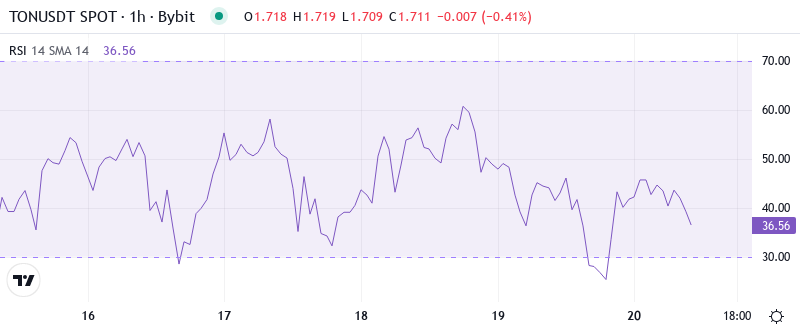
The Relative Strength Index (RSI) is an important indicator of overbought or oversold conditions in a market. RSI, on the daily timeframe, currently stands at 30.3. This is the first entry into the oversold region since the washout in August that was followed by a 40% relief rally. This extreme reading highlights that momentum exhaustion is at a juncture where contrarian traders typically begin to look for setups in the opposite direction, but the unlock of the token poses some unknown risks that were not in play in previous oversold bounces.
What is interesting here is that RSI hardly moved after the Coinbase news, which is an event that generally sets off those momentum explosions. Therefore, for swing traders, this fairly muted oscillator response and the imminent $161M unlock would likely see you waiting for that RSI 40 breach to be your confirmation bias before you go catch any falling knives, I mean the technicals are still pretty open to the downside if some of those unlock recipients decide to hot foot it out of there.
ADX Spikes to 51.6 – Conviction Behind This Downtrend Undeniable
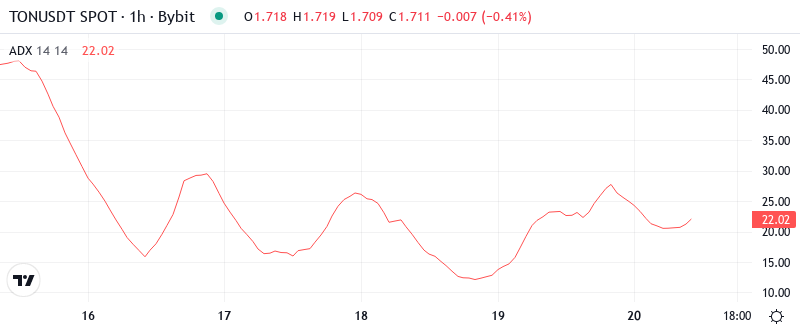
With the ADX at 51.6, it shows extreme trend strength that normally is seen at capitulation phases rather than at a healthy correction. This reading is even above the March 2024 crash, which means sellers are fully in the driving seat and haven’t reached exhaustion even with oversold RSI readings.
For those unfamiliar with TON, it is an infrastructure project supported by a wide range of services such as programming tools and a self-sovereign identity management system. The goal of TON is to create decentralized apps (dApps) and smart contracts, providing broad functionality beyond simple transfer of funds. The project held a high profile initial coin offering (ICO) in 2018, raising $1.7 billion from prominent VC funds, hedge funds, and other accredited investors. Over the past two years, TON has managed to develop the technology, release testnets, and secure several exchange listings for its native token. But despite the work done and hype over the technology, the protocol remains highly centralized due to the custody structure developed by the TON team. So, while the token’s listing partners will unlock the official network tokens this month, which have been tradable futures that TON offered over the past two years, it’s unlikely there will be broad adoption of the technology anytime soon.
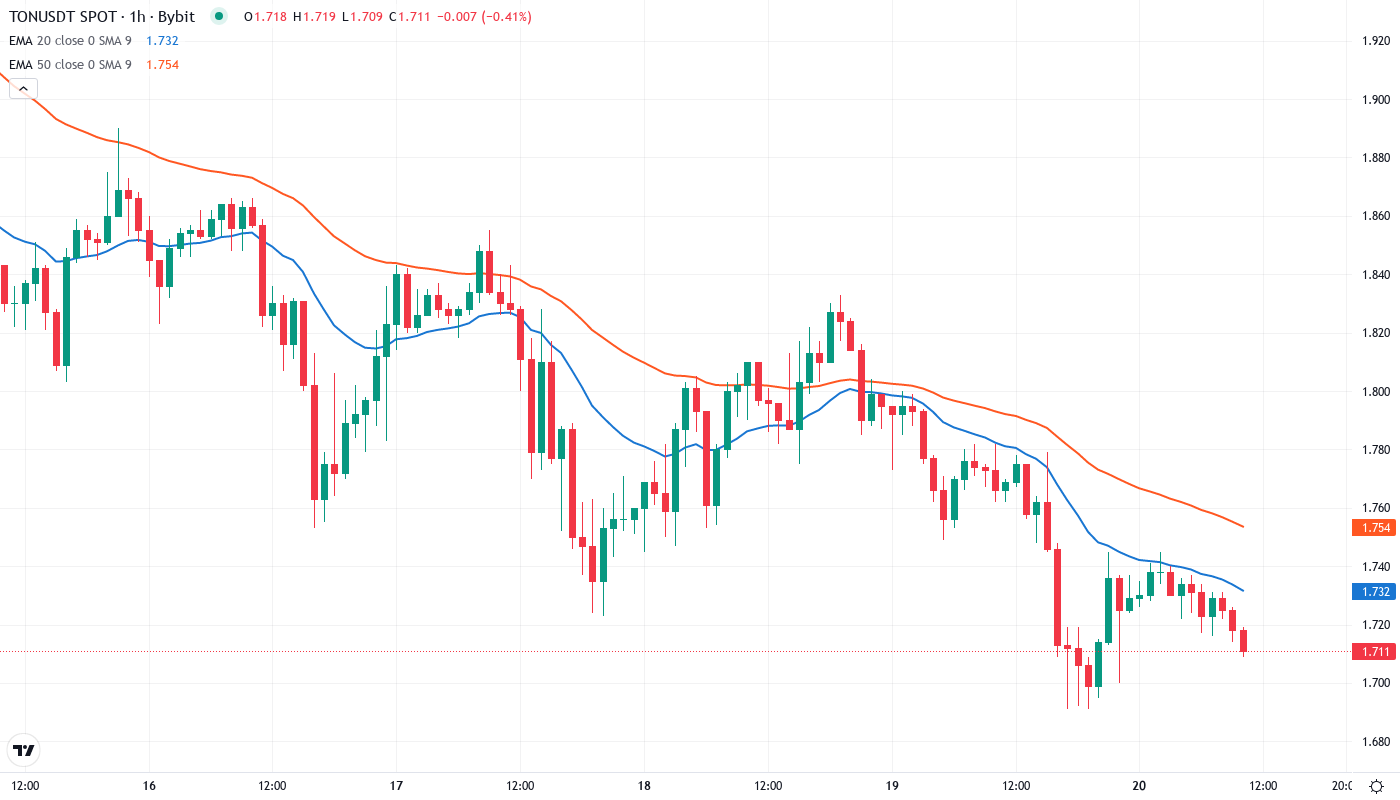
Price Trapped Below Entire EMA Ribbon Since December Break
The daily RSI at 39.45 and the MACD in negative territory also reflect TON’s negative pricing, while TON’s 21-week historical volatility of 94.75% still dominates among all tokens that got listed on FTX in 2021.
A more telling sign to watch will be the compression between the 20-day ($1.94) and 30-day ($2.03) EMAs, which often comes before volatile moves. With current positioning beneath all EMAs as well as the unlock catalyst, this compression likely resolves to the downside unless buyers can push back above at least the 10-day EMA at $1.84 – a level that blocked three attempts last week.
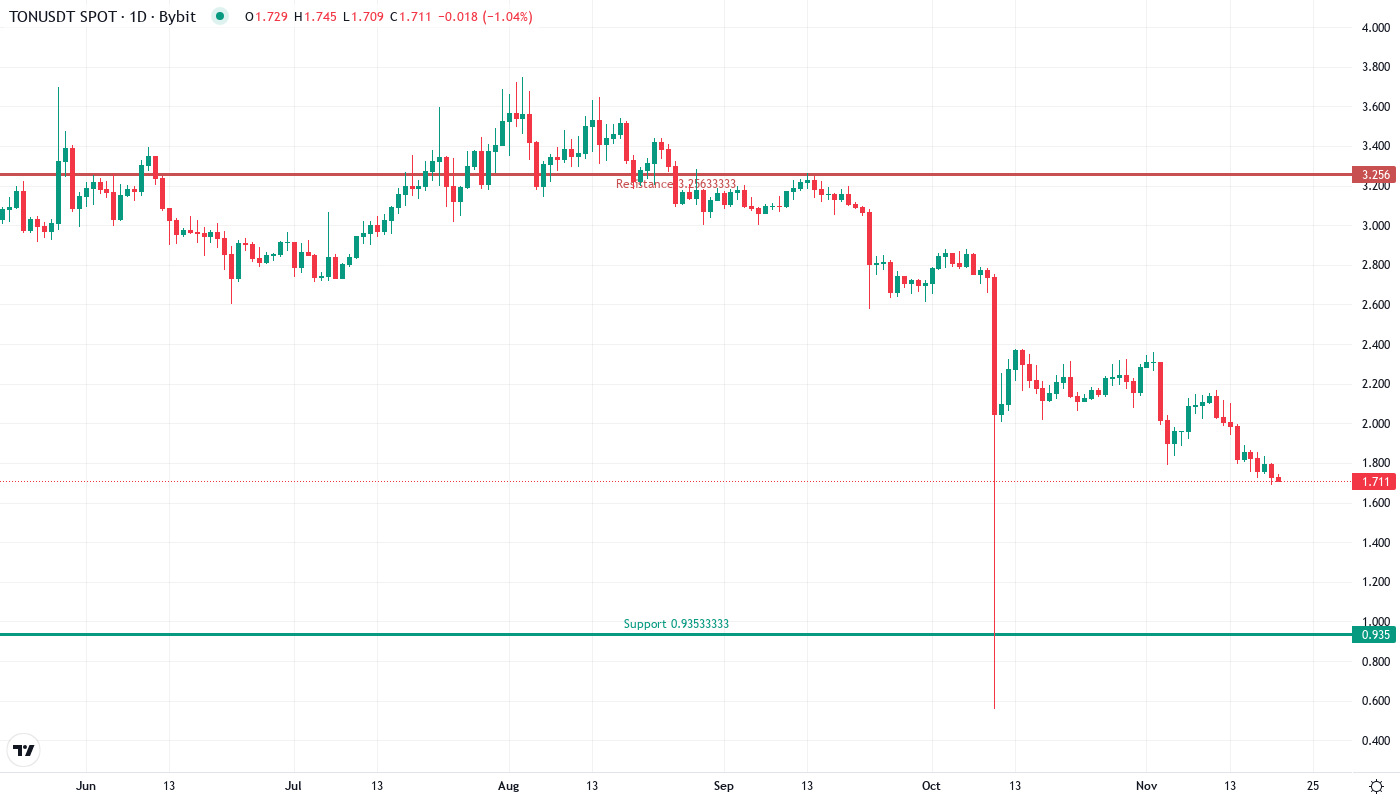
$1.69 Support Faces Ultimate Test as Monthly S1 Converges With Summer Lows
Sellers kept a tight grip on the resistance zone between $1.95 and $2.18 all December, and each subsequent attempt to break higher saw more supply come in—likely from early unlock receivers looking to offload part of their position. The monthly pivot at $2.07 serves as a solid ceiling, currently in confluence with the 30-day EMA, and bulls haven’t even retested it since the downtrend intensified.
The support architecture appears weaker now, with the prevailing price-perched test of the pivotal $1.69 level, the monthly S1, which also intersects August’s cap low. This is the final support of note before the $1-handle and YTD troughs around $1.20, meaning the line in the sand bulls will fight tooth and nail against, regardless of the looming unlock surge.
The Coinbase addition was a non-event, with the exchange mostly appealing to retail’s ‘dumb money.’ It’s no secret what the ETP unlock on Dec.16th will bring, either. The total size is minuscule compared to what’s about to hit the market. Given the dynamics of OTC trading in 2019 that happened at 30 cents, I don’t see who’d be aggressive on the bid to accumulate going into the unlock.
Token Unlock Shadow Demands Sub-$1.50 Test Before Any Sustainable Recovery
For buyers to take the upper hand, a daily candle above $1.84 is the first step. However, it still seems too soon for this to happen, considering the vast amount of unlocks approaching. While the overextended and favorable news situation may result in a relief rally, long-term viability is unlikely until the overhang from the unlock tapers off.
If the $1.69 support fails, there is a high probability of it occurring on volume, meaning stop-loss orders will be triggered. The $1.50 level is a likely stop, with a test of the yearly low at $1.20 possible. The extreme ADX reading and absence of any significant buying demand at these levels should continue to raise the odds of this scenario playing out if/when the final bottom is violated.
Considering the technical breakdown, imminent supply event, and the market’s uninterested response to good news, the most likely near-term trajectory has TON retesting $1.50-$1.55 as unlock receivers sell parts of their bags first before a solid rebound bids over $2.00.