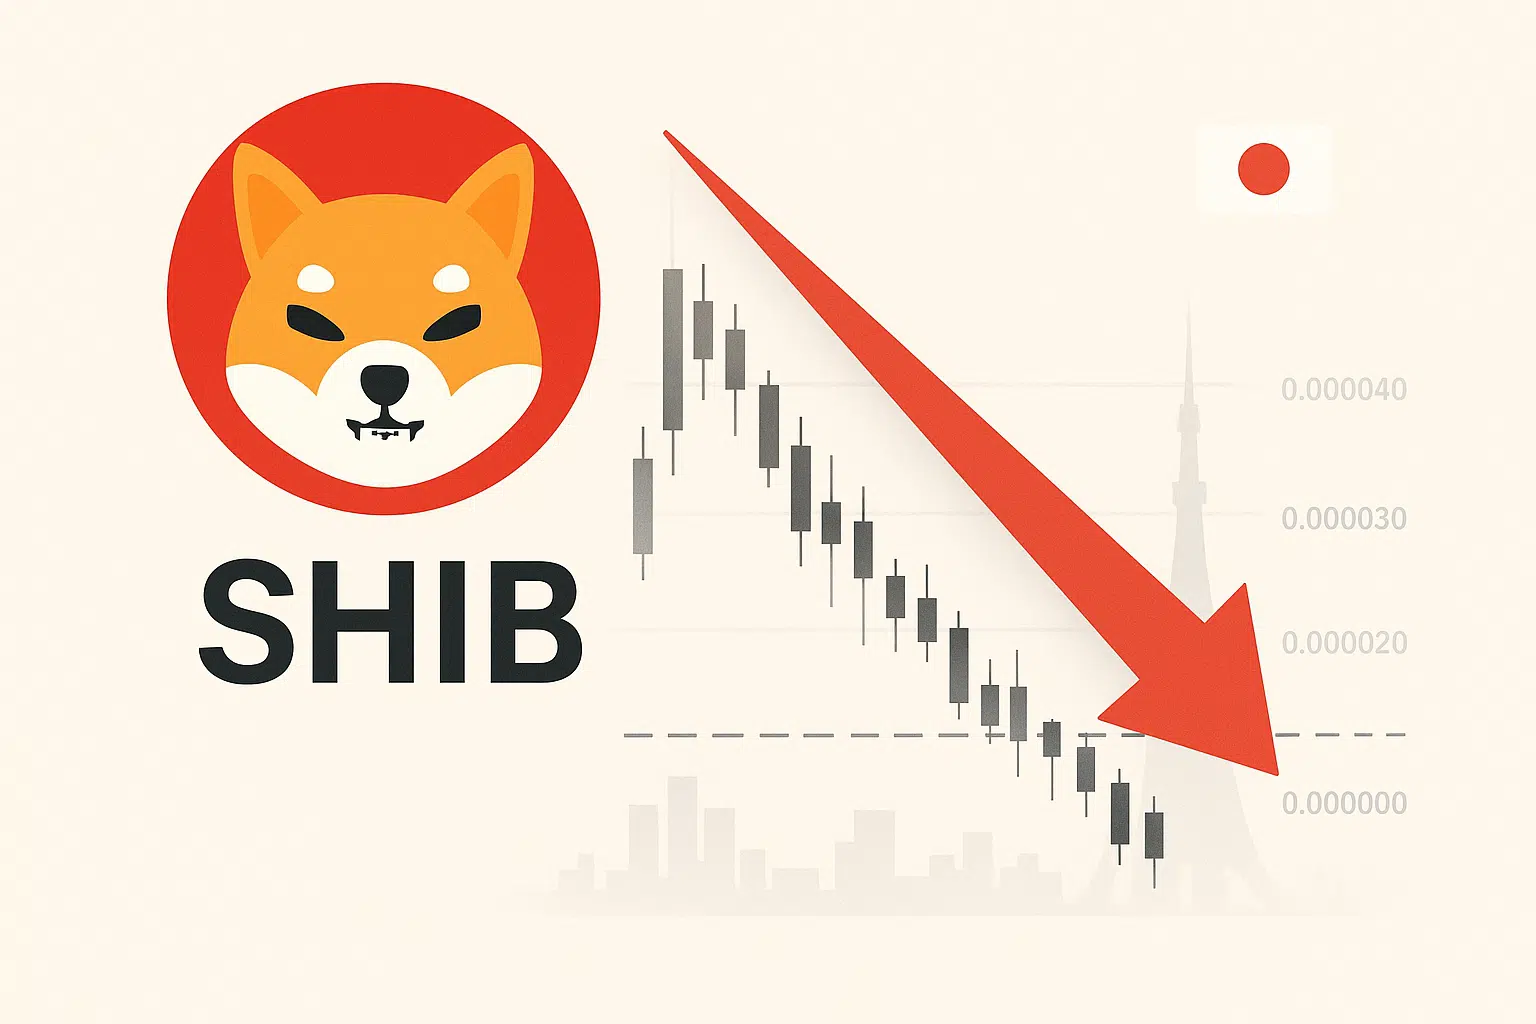
Shiba Inu Darts Through Support as Japan Green List Approval Meets Technical Breakdown
Market Structure Shifts Lower
- SHIB breaks critical support at $0.0000095 despite positive Japan regulatory news
- Technical indicators flash oversold after 14.9% weekly decline erases December gains
- Bulls defend $0.0000086 support zone tested multiple times since November
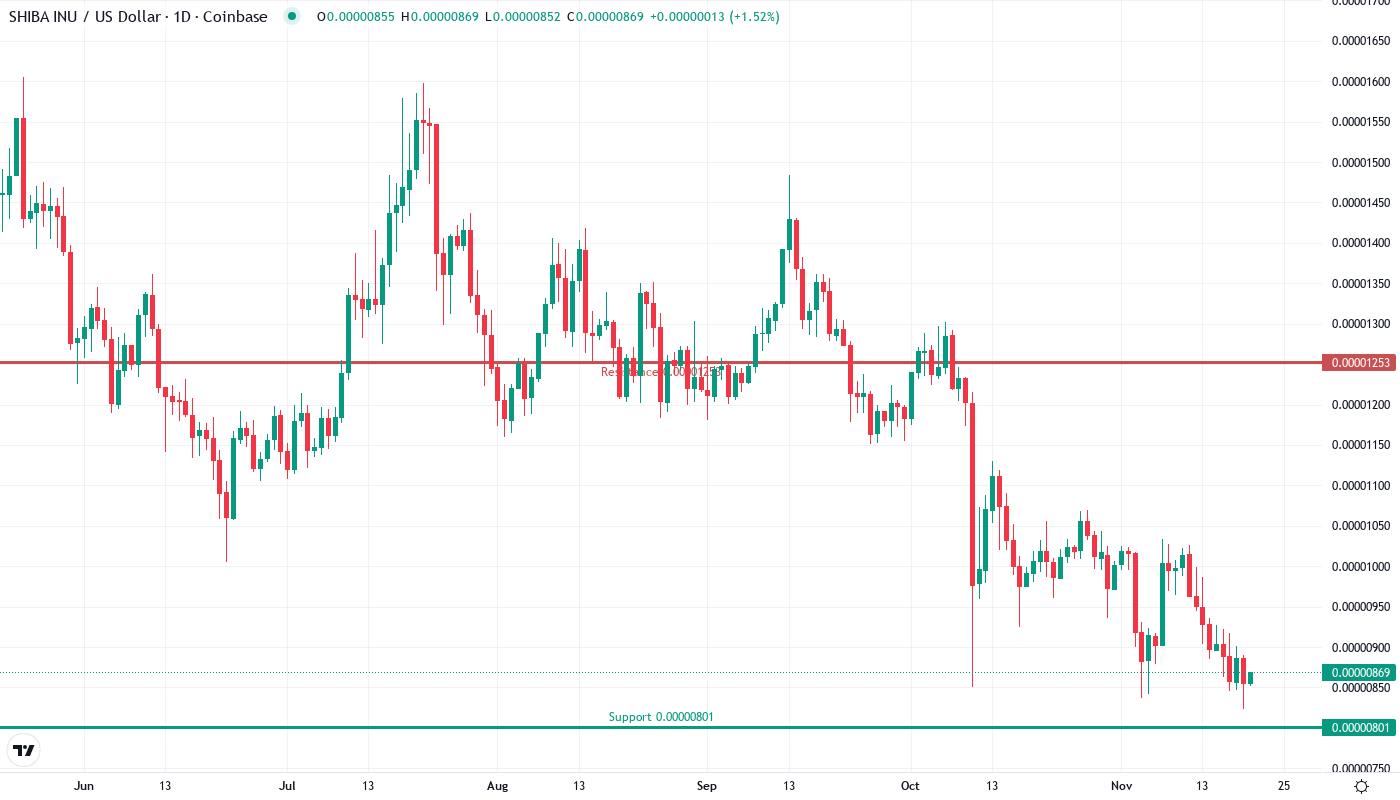
Shiba Inu has shed 14.9% over the past week, erasing its December recovery despite landing on Japan’s prestigious Green List for regulated trading. The meme coin tumbled from $0.0000102 to current levels near $0.00000867, with sellers overwhelming the positive regulatory developments that typically spark rallies. The main question for traders is: can bulls defend the $0.0000086 support that held throughout November, or will technical breakdown override fundamental catalysts?
| Metric | Value |
|---|---|
| Asset | SHIBA INU (SHIB) |
| Current Price | $0.00 |
| Weekly Performance | -8.64% |
| Monthly Performance | -14.92% |
| RSI (Relative Strength Index) | 38.0 |
| ADX (Average Directional Index) | 34.1 |
| MACD (MACD Level) | 0.00 |
| CCI (Commodity Channel Index, 20-period) | -97.87 |
Oversold RSI Hits 38 – Matches November’s Capitulation Low
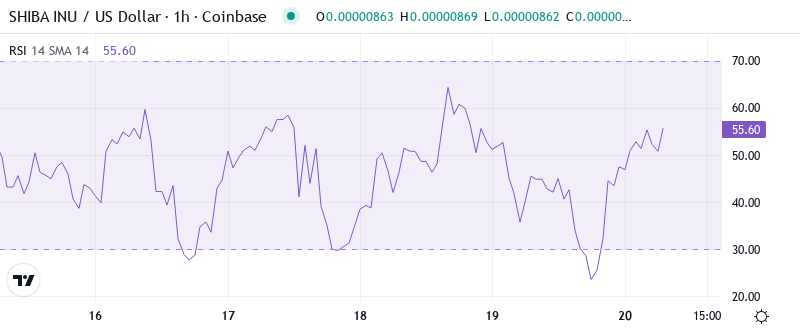
RSI sits at 38.00 on the daily timeframe, plunging into oversold territory for the first time since November’s washout. This sharp momentum collapse came despite Japan’s Green List approval and upcoming tax cuts that should theoretically boost demand. The disconnect between positive news flow and negative price action suggests technical sellers are dominating narrative-driven buyers.
What’s revealing is how RSI barely budged from oversold levels even as the Bitget wallet partnership and Shibarium RPC migration news hit the wires. Similar RSI configurations below 40 in August and November marked significant bottoms, but those occurred without the current fundamental tailwinds. So for swing traders, this oversold reading coupled with positive developments creates an interesting risk-reward setup if support holds.
ADX at 34.1 Signals Mature Downtrend Nearing Exhaustion
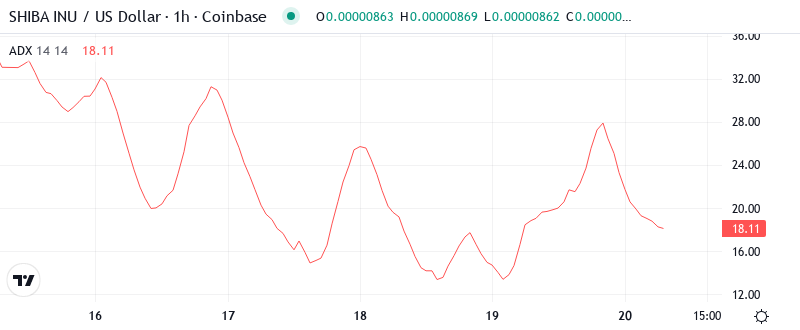
Looking at trend strength, the ADX reading of 34.11 indicates sellers have controlled price action with conviction. The surge from 24 to above 34 over the past week confirms this isn’t just profit-taking but genuine trend momentum. Basically, SHIB has shifted from consolidation mode to a defined downtrend that’s now approaching maturity.
Historically, ADX readings above 30 for SHIB tend to mark exhaustion points rather than continuation signals. The combination of oversold RSI and elevated ADX suggests the selling pressure that intensified after the Shibarium RPC warning may be running out of steam. Therefore, day traders should prepare for either a relief bounce from oversold conditions or a final capitulation spike if $0.0000086 breaks.
20-Day EMA Flips From Support to Resistance at $0.0000118
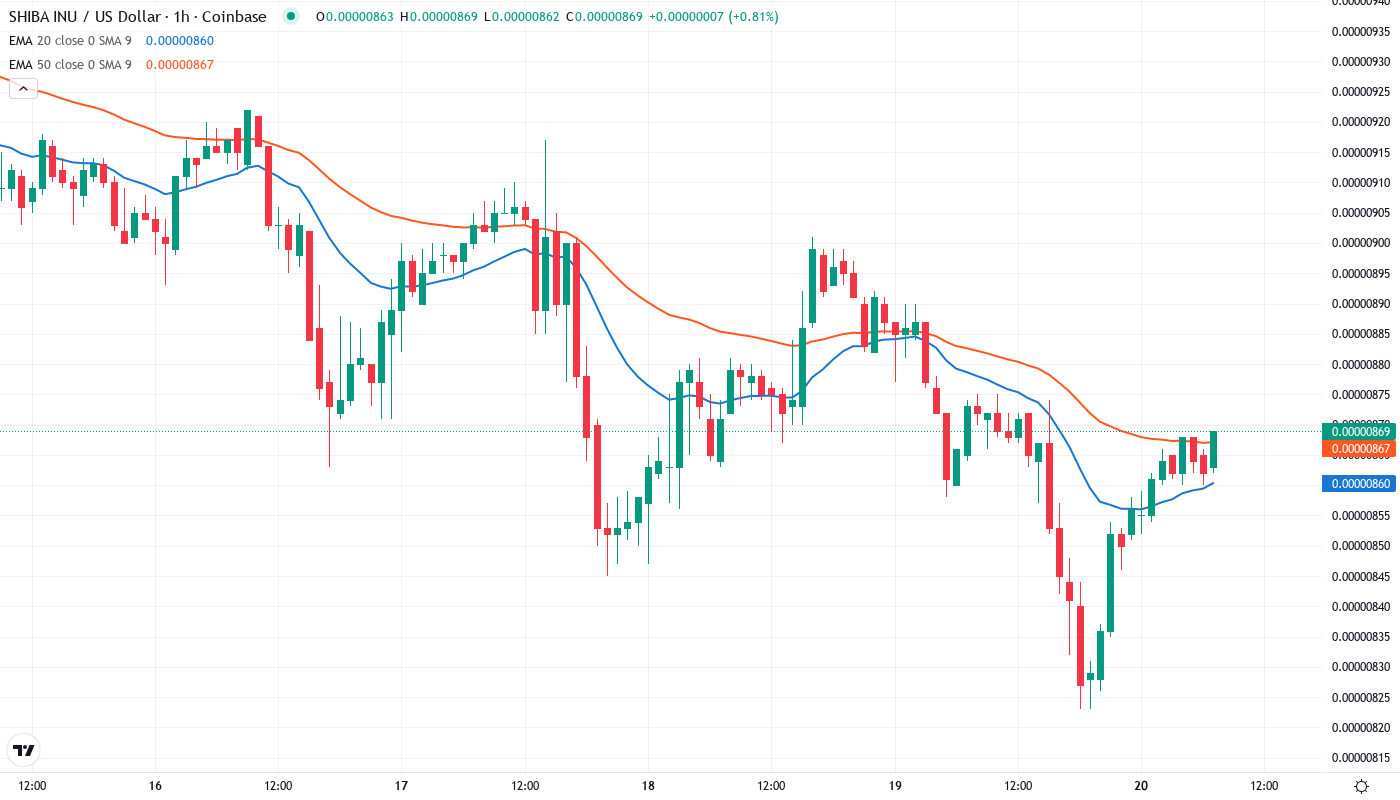
Price action through the EMA ribbons tells a clear story of deterioration. SHIB now trades below all major moving averages – the 10-day ($0.00000897), 20-day ($0.00000930), and crucially, the 50-day EMA at $0.00001011. The 20-day EMA that supported price throughout early December flipped to resistance after three failed reclaim attempts.
More concerning for bulls is the compression between the 50-day and 100-day EMAs, with the 50-day threatening to cross below. This potential death cross would confirm the longer-term trend shift despite Japan’s regulatory embrace. The 200-day EMA sits far above at $0.0000122, transforming from distant target to formidable resistance that capped December’s rally attempt.
Support at $0.0000086 Faces Sixth Test Since November
Resistance now stacks heavy between the psychological $0.000010 level and the 50-day EMA at $0.0000101. December’s highs near $0.0000107 align with the monthly R1 pivot, creating a double resistance zone that rejected price decisively. The failed breakout above this cluster triggered the current selloff despite the Japan Green List catalyst that should have propelled price higher.
Bulls defend a crucial support zone at $0.00000860-867 that has held through six tests since November. This level gains significance as it marks the convergence of horizontal support and the monthly pivot point. The repeated bounces from this zone suggest accumulation, though each test weakens the foundation.
The market structure reveals a critical inflection point where positive fundamental developments clash with negative technical momentum. The Bitget card launch and Japan tax advantages provide long-term catalysts, but technical breakdown signals dominate near-term price action. This disconnect between news and price often marks significant turning points.
Bulls Need Volume Reclaim Above $0.0000095 to Shift Momentum
Should price reclaim the $0.0000095 level on volume, bulls could target the 20-day EMA at $0.0000093 and then the psychological $0.000010 barrier. The Japan Green List inclusion and major tax cuts set to benefit SHIB holders provide the fundamental ammunition for a recovery if technical buyers return.
The bearish scenario triggers if $0.00000860 support fails on a daily close. This would trap recent dip buyers counting on the Japan catalyst and likely flush positions toward the next support at $0.0000075 – roughly 13% below current levels. The Shibarium RPC migration concerns could amplify selling if perceived as operational risk.
Given the oversold conditions and repeated support defense at $0.00000860-867, the most probable near-term path involves a relief bounce toward $0.0000092-95 before sellers reassert control. The fundamental catalysts from Japan provide a floor for now, but technical structure must improve for sustainable recovery.