AVAX Tests Critical Support as Momentum Exhaustion Signals Capitulation Phase
Market Structure Shifts Lower
- Avalanche dropped 15% this week to $14.30, erasing November’s recovery attempt
- RSI plunged to 30.43 – first oversold reading since the August washout
- Bulls defend the $13.72 monthly low as six-month downtrend accelerates
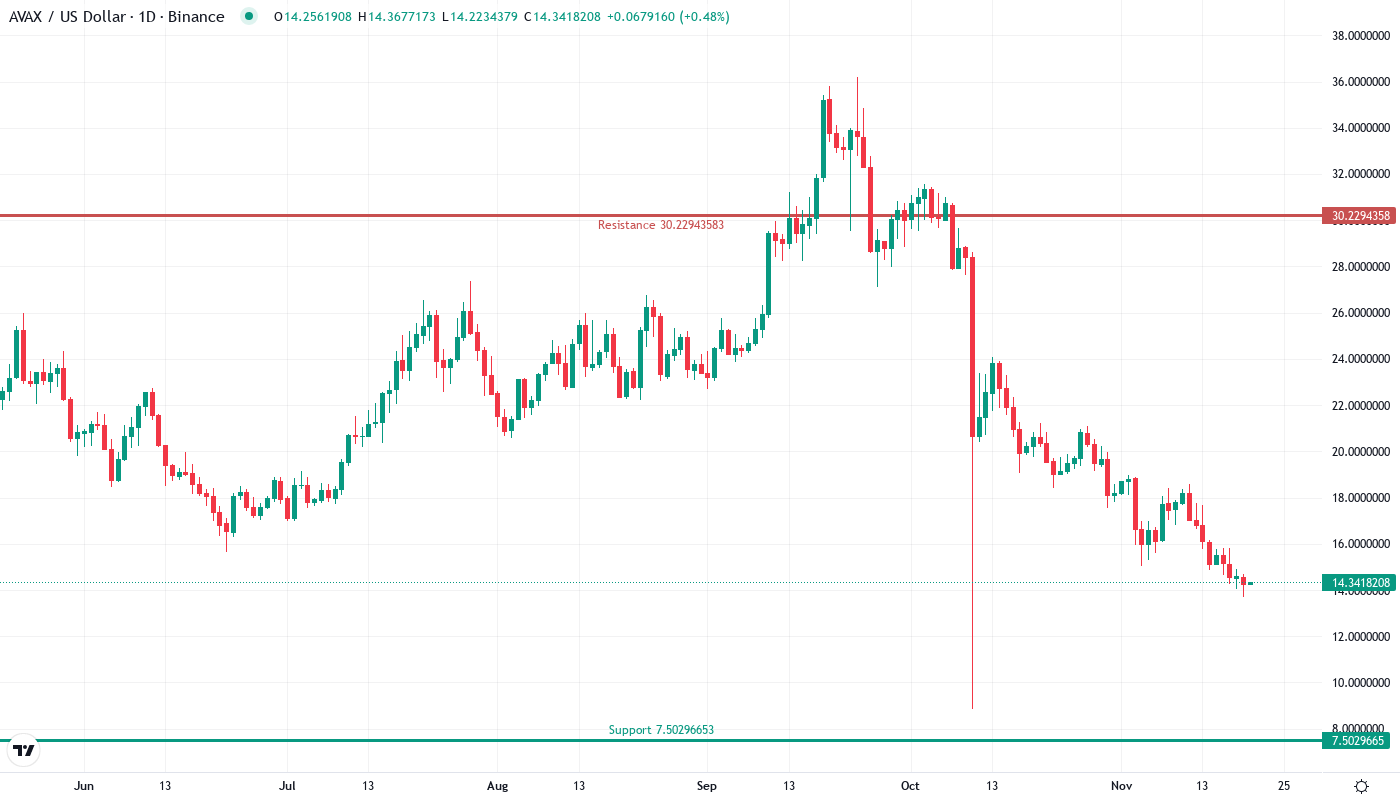
Avalanche’s price action tells a story of sustained selling pressure, with AVAX tumbling 15% over the past week to $14.30 after failing to sustain any meaningful bounce from recent lows. The decline extends a brutal six-month slide that has now erased 58% from yearly highs, with the token down 30% in just the past month alone. System upgrades focusing on interoperability enhancements couldn’t stem the bleeding as broader market weakness overwhelmed any positive fundamental developments. The main question for traders is: has AVAX finally found a floor at these deeply oversold levels, or does the chart suggest more pain ahead?
| Metric | Value |
|---|---|
| Asset | AVALANCHE (AVAX) |
| Current Price | $14.30 |
| Weekly Performance | -14.94% |
| Monthly Performance | -29.70% |
| RSI (Relative Strength Index) | 30.4 |
| ADX (Average Directional Index) | 52.7 |
| MACD (MACD Level) | -1.62 |
| CCI (Commodity Channel Index, 20-period) | -120.33 |
Momentum Exhaustion Reaches Levels Last Seen Before August Rally
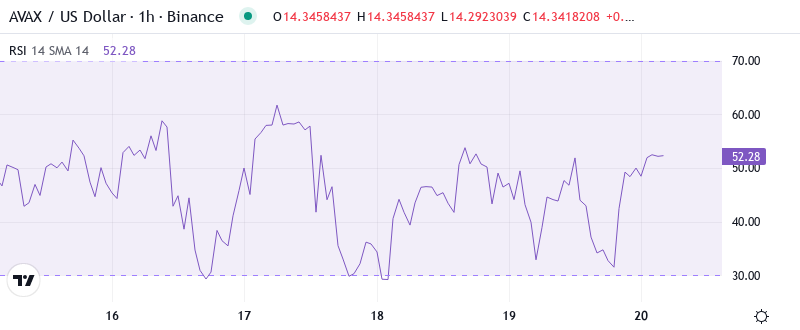
RSI sits at 30.43 on the daily timeframe, marking the first genuine oversold signal since August’s capitulation bottom. Back then, similar readings preceded a sharp relief rally that carried price 40% higher within weeks. The oscillator’s weekly reading of 36.17 reinforces this exhaustion thesis, though it hasn’t quite matched the extreme 25 print from the summer washout that marked the absolute bottom.
What’s revealing is how RSI behaved during the recent system upgrade news – it barely budged from oversold territory despite the positive catalyst. This disconnect between fundamentals and technicals suggests sellers remain firmly in control, using any uptick in buying interest as liquidity to exit positions. So for swing traders, this oversold bounce setup requires confirmation through a daily close above 35 on the RSI before considering long entries.
Weak ADX at 52.73 Signals Mature Downtrend Nearing Exhaustion
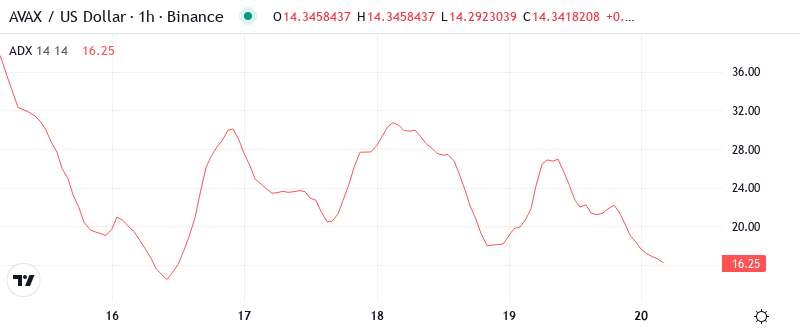
Looking at trend strength, the ADX climbed to an extreme reading of 52.73, indicating the downtrend has reached a mature phase where exhaustion typically emerges. Historically, ADX readings above 50 mark unsustainable momentum that often precedes sharp reversals or at least meaningful consolidation periods. The indicator hasn’t printed this high since the March 2024 selloff that ultimately bottomed near current levels.
To clarify, while the ADX confirms strong directional movement, such extreme readings suggest the easy money has already been made on the short side. Day traders should adapt their strategies accordingly – chasing shorts at these levels resembles picking up pennies in front of a steamroller. The optimistic market sentiment around Avalanche’s bullish setup analysis could provide the catalyst for a snapback rally once this selling exhaustion plays out.
20-Day EMA at $16.42 Becomes First Resistance Target for Any Recovery
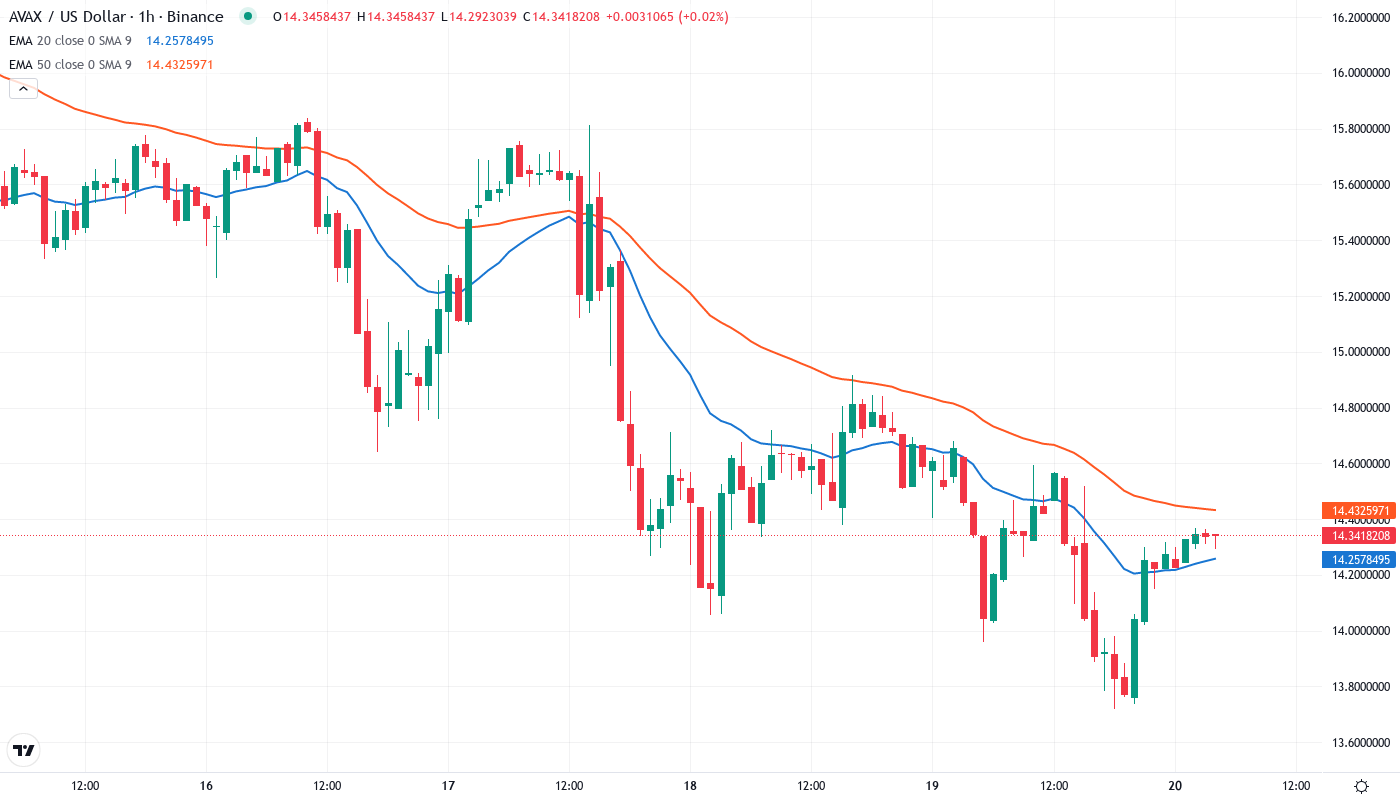
Price action through the EMA ribbons paints a clear picture of bearish market structure. AVAX trades well below the entire moving average stack, with the nearest resistance sitting at the 20-day EMA ($16.42) – roughly 15% above current levels. The 50-day EMA at $19.47 and 100-day at $21.60 loom even further overhead, creating multiple resistance layers that bulls must reclaim to shift the narrative.
More telling is the compression between the 10-day ($15.27) and 20-day EMAs, which typically precedes explosive moves. Given the oversold conditions and extreme ADX reading, this coiled spring formation favors an upside resolution. The 200-day EMA at $22.95 represents the ultimate test for any sustainable recovery – that level changed from being a support floor to formidable resistance after December’s breakdown.
Monthly Low at $13.72 Anchors Final Defense Before Deeper Capitulation
The immediate support zone spans from $13.72 to $14.30, where the monthly low meets current consolidation. Bulls have defended this area three times over the past two weeks, establishing it as a legitimate floor. Each bounce has attracted buyers willing to bet on mean reversion from these oversold extremes, though follow-through remains elusive.
Above current price, sellers have stacked resistance between $15.27 (10-day EMA) and the psychological $16 level. This zone rejected advances twice in recent sessions despite the OCC news allowing banks to hold crypto for transaction fees – a development that should have provided fundamental support. The monthly pivot at $19.53 marks the next major hurdle, sitting just below the critical 50-day EMA.
This configuration resembles a textbook accumulation pattern, with smart money potentially building positions while retail capitulates. The “final accumulation window” thesis gains credibility as long as that $13.72 floor holds on any retest. Market structure signals a potential trend reversal brewing, but confirmation requires reclaiming at least the 20-day EMA with conviction.
Bears Need Break Below $13.72 to Target $11 Next Major Support
Bears require a decisive daily close below $13.72 to confirm continuation of the six-month downtrend. Such a breakdown would expose the psychological $12 level initially, with measured move targets pointing toward $11 based on the recent consolidation range. The lack of meaningful support below current levels creates an air pocket that could accelerate selling if stops get triggered.
The bullish reversal activates on a daily close above $16.42 (20-day EMA) with expanding volume. This would trap late shorts and likely trigger a squeeze toward $19.50, where the 50-day EMA coincides with the monthly pivot. System upgrade developments and growing institutional adoption provide the fundamental backdrop that could fuel such a recovery once technical conditions align.
Given the extreme oversold readings and mature downtrend indicators, the most probable near-term path sees AVAX establishing a bottom between $13.72-$14.30 before attempting a relief rally toward $16-17. The combination of technical exhaustion signals and positive fundamental developments suggests the risk-reward finally favors patient bulls after six months of relentless selling.