BNB Tests Critical Support at $919 as BlackRock Partnership Sparks Institutional Interest

Market Structure Shifts Higher
- BNB hovers precisely at its weekly open after a 17% monthly decline, finding buyers at the $919 psychological level
- BlackRock-Binance partnership announcement creates institutional narrative shift despite bearish price action dominating
- Technical indicators flash mixed signals with RSI neutral but ADX showing trend strength building from recent lows
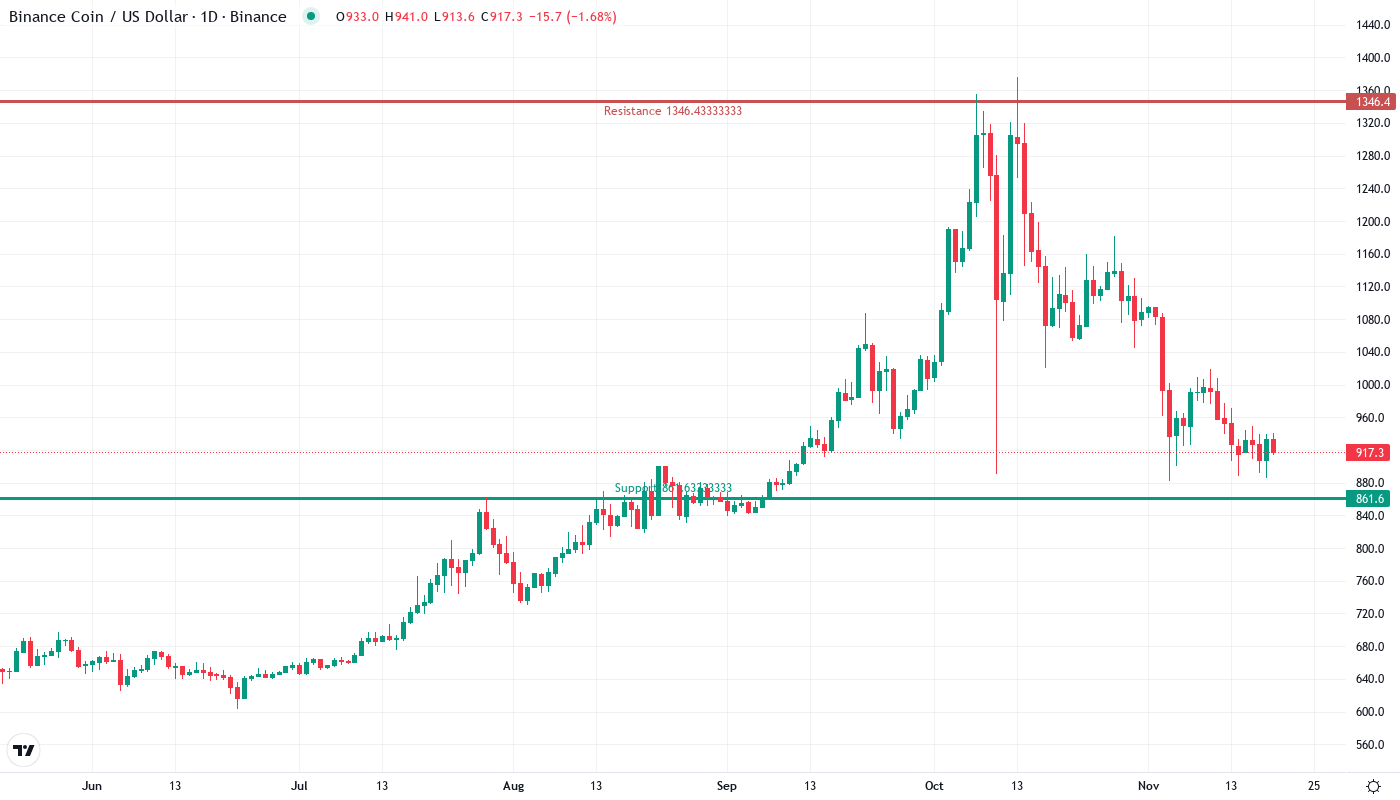
Binance Coin trades flat at $919.30, matching both its weekly and monthly close levels after enduring a devastating 17.2% drop over the past month. The sharp decline from December’s $1,182 peak has erased nearly all of November’s gains, though the 48.4% yearly performance remains intact. What’s interesting is how price found support exactly at the weekly open – a level that institutional players often defend – just as news of the BlackRock partnership hit the wires. The main question for traders is: can this fundamental catalyst shift the technical picture, or will sellers continue pressing lower toward the $882 monthly low?
| Metric | Value |
|---|---|
| Asset | BNB (BNB) |
| Current Price | $919.30 |
| Weekly Performance | -4.14% |
| Monthly Performance | -17.19% |
| RSI (Relative Strength Index) | 37.5 |
| ADX (Average Directional Index) | 32.3 |
| MACD (MACD Level) | -42.66 |
| CCI (Commodity Channel Index, 20-period) | -70.82 |
RSI Holds Neutral Territory Despite 17% Monthly Slide
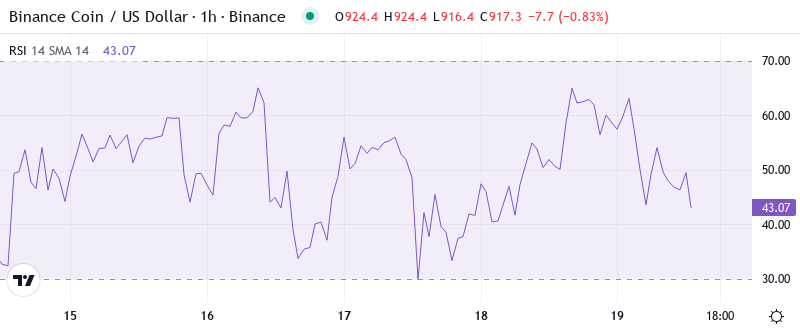
RSI sits at 49.02 on the daily timeframe, hovering in perfectly neutral territory despite the aggressive selloff from December highs. This balanced reading suggests the market hasn’t reached capitulation levels yet – typically seen when RSI drops below 30. Looking back, similar mid-range RSI configurations after sharp declines in September and June preceded consolidation periods rather than immediate reversals.
For swing traders eyeing entries, this neutral momentum means there’s room for movement in either direction without immediate oversold bounce risk. The BlackRock partnership news could provide the catalyst to push RSI higher, but technically speaking, bulls need to see momentum climb above 60 to confirm any sustainable recovery attempt.
ADX at 32.34 Confirms Active Downtrend Still in Play
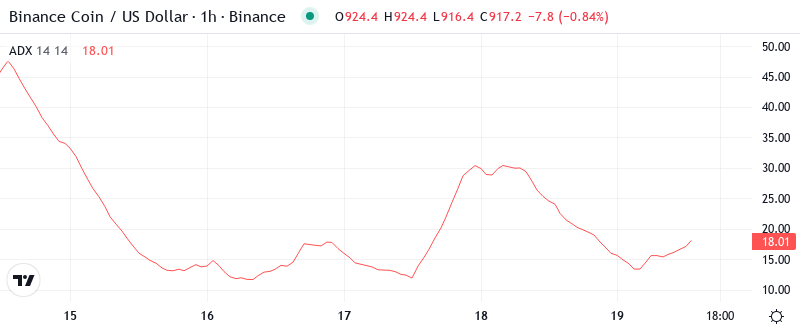
At the level of 32.34, the ADX reading indicates that the existing downtrend maintains serious conviction. Basically, when ADX climbs above 30 like this, it signals that the prevailing trend – bearish in this case – has genuine strength behind it. The indicator peaked near 40 during the steepest part of December’s decline before moderating slightly.
What’s revealing here is how ADX remains elevated even as price attempts to stabilize at $919. To clarify, this suggests sellers aren’t exhausted yet despite the institutional partnership news. Day traders should adapt their strategies to this trending environment – quick scalps on bounces rather than position building until ADX drops below 25 to signal trend exhaustion.
20-Day EMA at $972 Caps Recovery Attempts After December Breakdown
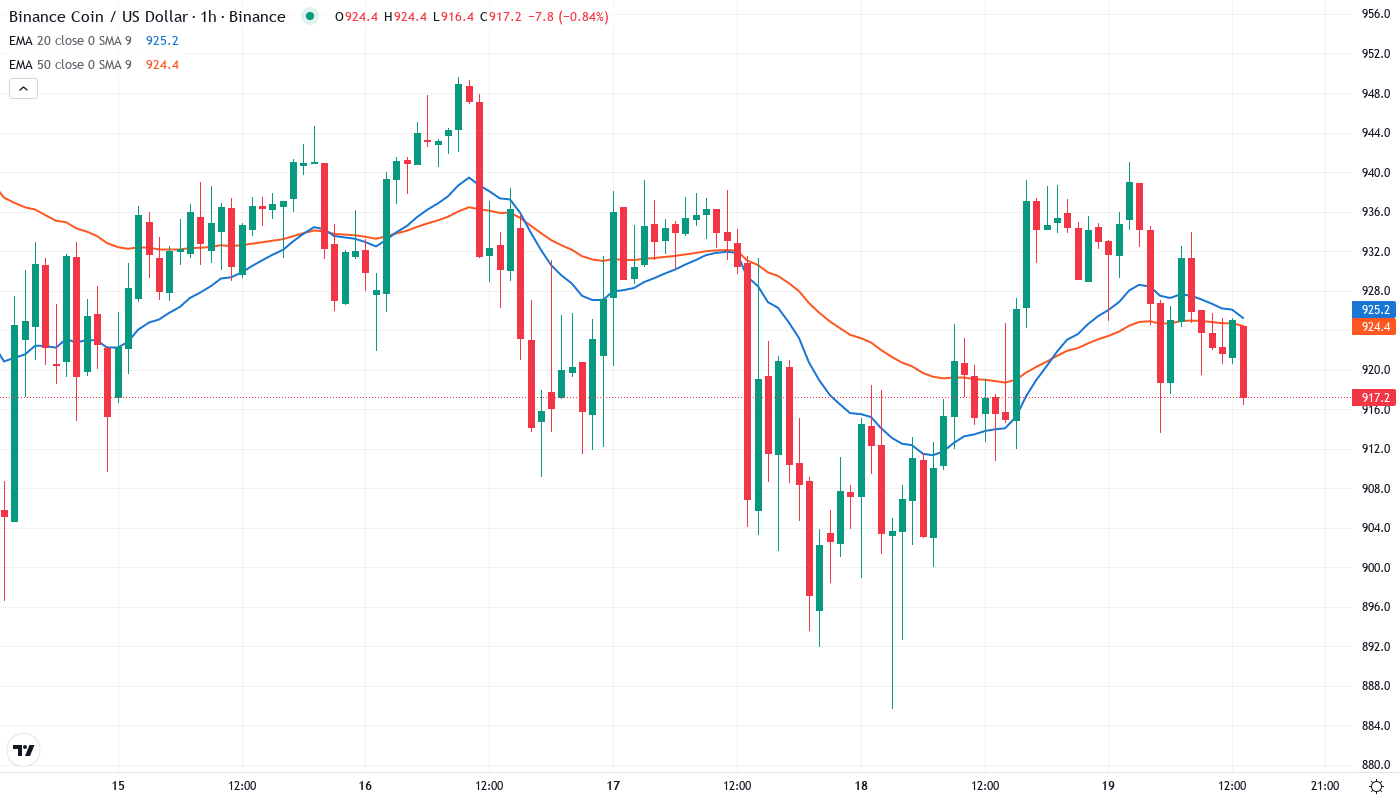
Price action tells a clear story through the EMA structure. BNB currently trades below the entire moving average ribbon, with the nearest resistance sitting at the 10-day EMA ($939). More significantly, the 20-day EMA at $972 and the 50-day at $1,011 create a formidable resistance zone that rejected rally attempts twice in late December.
Looking at the broader picture, the 100-day EMA way up at $975 hasn’t been tested since the breakdown began. That former support area between $970-975 now transforms into a red line for bears to defend. The BlackRock news might spark a relief rally, but bulls face a gauntlet of overhead resistance before any trend reversal can materialize.
Resistance Stacks From $989 to $1,032 as Monthly Pivots Align
Above current levels, sellers have fortified multiple resistance zones that coincide with technical and psychological barriers. The immediate hurdle sits at $989 where the weekly pivot meets round-number resistance. Beyond that, the monthly pivot at $1,032 aligns with the psychological $1,000 level – a confluence that typically attracts heavy selling pressure.
Support architecture looks more promising for bulls defending current levels. The $919 zone has already proven its importance by matching the weekly open, while deeper support waits at $906 (weekly S1) and the monthly low of $882. This $882 level gained significance after holding during three separate tests in early December.
Crucially, the market structure suggests a compression between $882 support and $989 resistance. This $107 range might contain price action until either the BlackRock partnership generates real buying flow or technical sellers overwhelm the support zones. The pattern resembles a descending triangle, which traditionally resolves lower unless fundamental catalysts intervene.
Bulls Need Decisive Close Above $972 to Shift Momentum
For bulls to capitalize on the BlackRock catalyst, they must engineer a daily close above the 20-day EMA at $972. This would flip the first major resistance to support and open a path toward the psychological $1,000 barrier. Only sustained trading above $1,032 would confirm a genuine trend reversal.
The bearish scenario triggers if $919 fails on volume, exposing the monthly low at $882 to renewed testing. A breakdown there would likely flush positions down to the weekly S2 at $901 initially, with $800 as the next major psychological target. Such a move would trap recent buyers betting on the institutional partnership narrative.
Given the elevated ADX reading and price position below all major EMAs, the most probable near-term outcome is continued consolidation between $882-$989. The BlackRock news provides fundamental support, but technical sellers still control the chart until proven otherwise.