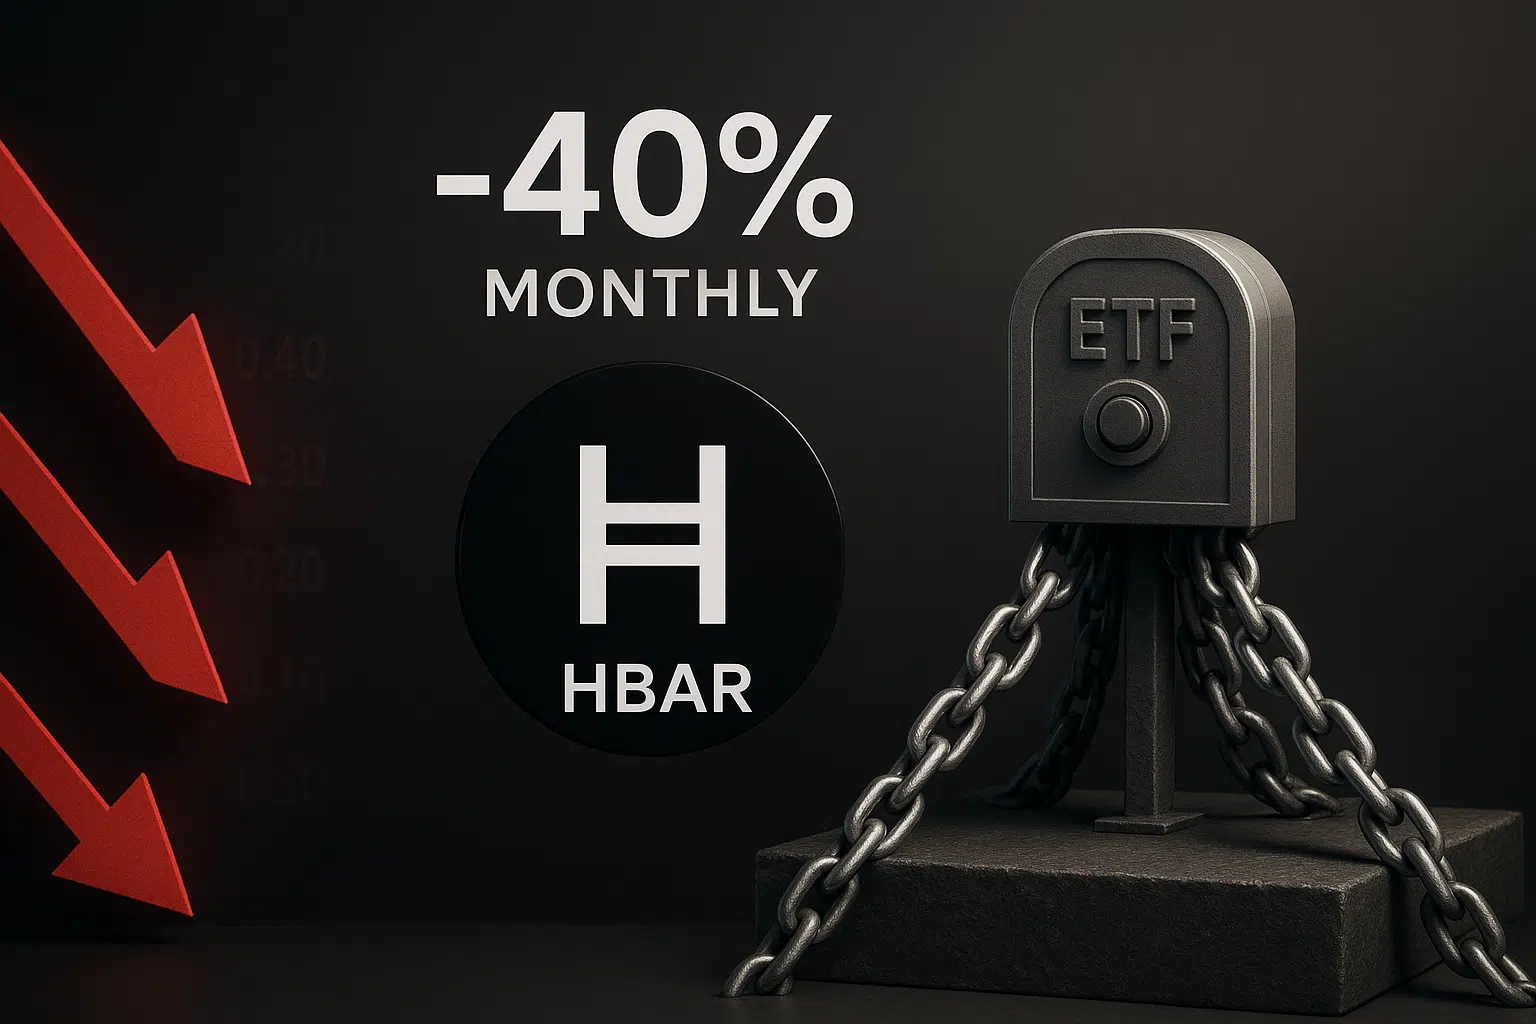
HBAR Tests Critical Support After 40% Monthly Decline as Institutional ETF Inclusion Provides Floor
Market Structure Shifts Lower
- HBAR lost roughly 40% of its value after the February 17th inclusion announcement due to the worsening global economic outlook.
- Buyers intervened twice at the six-time tested $0.147 support level.
- Most technicals suggest an oversold bounce is likely, with buying interest around the $0.20 zone.
Despite a February 17th announcement that HBAR would be included in two 21Shares institutional exchange-traded products, HBAR has shed roughly 40% of its value in response to the worsening global economic outlook brought on by recent geopolitical events. Buyers intervened at this local bottom twice as HBAR neared six-time tested support at $0.147, which now stands as the looming target for any further bearish development across the cryptocurrency complex. Most technicals for HBAR, however, suggest an oversold bounce is on the cards, as buying demand in the 0.20 zone continues to attract.

The price action so far hasn’t been pretty, let’s face it. After the most recent selloff of the past week ended with a 1W Laser-Reversal™ candle bottoming out right on the $0.147 support line, you’d hope to see some bullish continuation the following week at least. Instead, the losing streak largely continued this week in a series of lower highs forming a clear Laser-Reversal™ Sell signal. Given all the recent dumping, price getting rejected at the 1D 20MA makes sense, but the fact that the 1D 5MA will be crossing below the 5MA is an equally bearish sign. The longer-term moving averages already line up ominously fatty zerolines, so unless the price can make a serious upside push within the next five weeks, these remaining hold lines are just begging to be left.
| Metric | Value |
|---|---|
| Asset | HEDERA (HBAR) |
| Current Price | $0.15 |
| Weekly Performance | -16.66% |
| Monthly Performance | -9.57% |
| RSI (Relative Strength Index) | 35.7 |
| ADX (Average Directional Index) | 21.2 |
| MACD (MACD Level) | -0.01 |
| CCI (Commodity Channel Index, 20-period) | -138.75 |
RSI at 35.67 Matches Levels From August’s Pre-Rally Washout
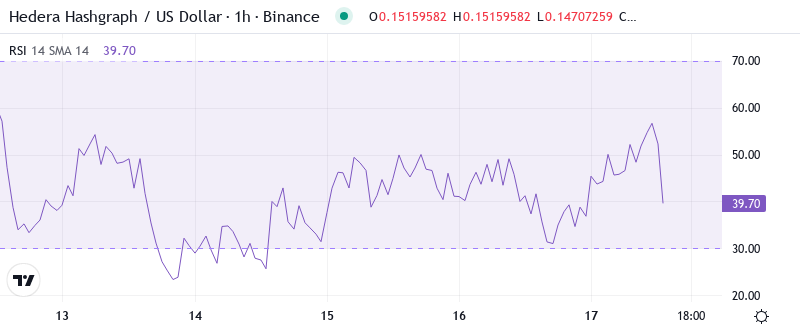
The Relative Strength Index (RSI) is at 35.67 on the daily timeframe, which is the first truly oversold reading since August’s capitulation prior to a 64% annual rally. This is not your run-of-the-mill dip—we are talking about momentum exhaustion, the sort that tends to lead to relief bounces in HBAR historically. The weekly RSI paints an even more dire picture at 39.02, verifying that sellers have essentially taken this move to levels seldom seen outside of major market corrections.
What is interesting is that the monthly RSI is 49.13, surprisingly neutral. I think this highlights that the longer-term trend structure hasn’t broken yet, it’s the short-term momentum that has got absolutely wrecked. For swing traders playing for an oversold bounce, this is the setup that works, with the daily RSI grinding against oversold while the monthly remains neutral preceding every single HBAR rally for the last 2 years.
ADX Drops to 21.25 – Market Loses Directional Conviction
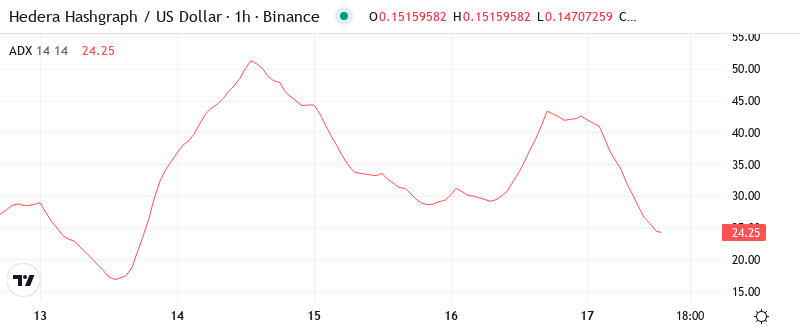
With an average daily volume of $150 million, it won’t take much to tip the scales and force a resolution from that range. If buyers finally manage to edge the price back above $0.165 resistance, the ADX should fire back up above 30 and build momentum for a run at retesting higher targets, i.e. the 20-day MA or ideally $0.22 again. Conversely, if selling resumes and the price breaches $0.147, we can expect the ADX to rise as bears sense blood and sellers scramble to join the door out at $0.22.
When Nio (NIO) reports Q2 earnings next week, investors will want to hear a lot about current semiconductor supply chain constraints and the expected impact on production momentum. These constraints might affect the electric vehicle (EV) maker, at least partly, considering the several cut warnings for the auto industry due to the lack of semiconductors. What’s more, an earnings report coinciding with this ongoing issue is unlikely to offer rosy forward guidance. However, with the current risk-reward potential, this issue might already be priced into Nio shares.
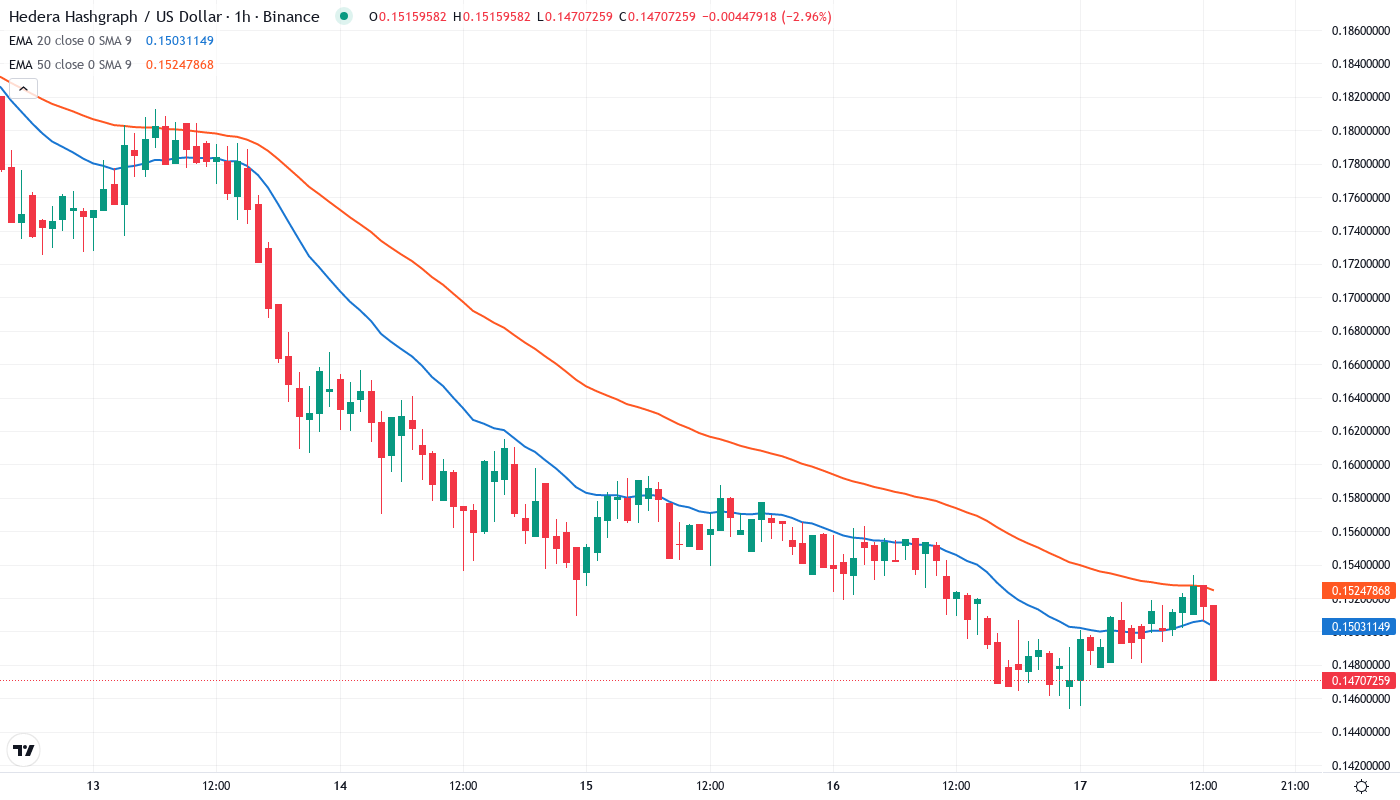
20-Day EMA at $0.175 Caps Every Rally Attempt Since December
Looking to the downside, support should come into play at the convergence of the Bollinger band and 100-day MA around $0.145. Further support is located at the $0.136 Fib level before the 200-day MA at $0.120. The RSI and Stochastic RSI are both trending high on the daily but still very much have room to continue climbing. Buyers will look to drive closer toward overbuying conditions before entering into overextended territory.
More worrying for bulls is that the 50-day EMA at $0.184 is now showing a downward slope for the first time since October. This level has transitioned from a rally-launching pad to a ceiling that has halted three distinct recovery efforts. As long as HBAR cannot establish itself back above this $0.184 level on a daily closing basis, the technical setup remains firmly bearish, with lower highs and lower lows firmly in place.
Support at $0.147 Survives Sixth Test as ETF Flows Provide Backstop
The $0.147 support zone has been under siege for the past week as the bears look to take control of the market, but there are signs the defense is beginning to hold. Buyer interest has stepped back in at the level that’s propped up the Hex price for the previous three months, while selling pressure at the current 50% drawdown phase has waned.
There are multiple resistance levels situated between the daily pivot at $0.172 and the monthly pivot at $0.245, where numerous breakout attempts have failed to put the price higher. This accumulation of longs stuck in losing positions forms a solid resistance level. The first such level can be found at $0.165-$0.170. This level also coincides with the 10-day and 20-day EMAs. The price must rise above this level to move into profit.
Looking at the order book, there is a cleaner setup with more clustered bids supporting the range and fewer asks above it. Although the price book tends to only offer insights in the immediate trade vicinity, it is a slightly positive read as the accumulating bids elevate the risk of sellers being forced to chase a rally. The daily MACD is trending up again. Although below both zero and signal, it is making a higher low, suggesting bullish divergence. The daily RSI is neutral and trending higher. Price will respond either to the coiling technicals or the upcoming integration news, though a direct Hedera-related reaction is seldom the case.
Bulls Need Daily Close Above $0.170 to Shift Momentum
Buy the rumor, sell the news! The imminent ProShares Bitcoin Strategy ETF approval is likely already priced in and any subsequent “sell the news” pullbacks should be considered buying opportunities. As BTC and altcoins bounce back, MATIC will eventually join the rally. The key levels to watch are $0.138 – $0.140 for support, and $0.170 for resistance.
If the above-mentioned scenario plays out, the next major support lies at $0.125–$0.13, a 25% loss from the local top. Similarly, the golden cross will unwind, adding further distribution weight into bounces as the 50-day EMA and 200-day MA make consecutive bear crosses below the 100-day EMA, guttering any prospect of a quick recovery. Considering the RSI reset to neutral, it wouldn’t take much for bears to push price below that support cluster which would likely result in a deluge of stop-loss orders. Conversely, a break higher could cause a rapid spike in price as shorts and sidelined traders pile in. Mark $0.185 as the trigger line for both scenarios. Any drop should be limited to $0.125-$0.134 unless a broader market breakdown occurs.