Solana Tests Six-Month Lows as ETF Speculation Meets Technical Resistance

Market Structure Shifts Lower
- Despite a torrent of good news for Solana (SOL) and a frenzy of institutional ETF filings in the past week, December’s price swoon continued through the final day of January.
- SOL ended January down 27% for the month.
- Key question: will upcoming ETF listings be enough bullish fuel to recapture major support levels and the 50-day EMA?
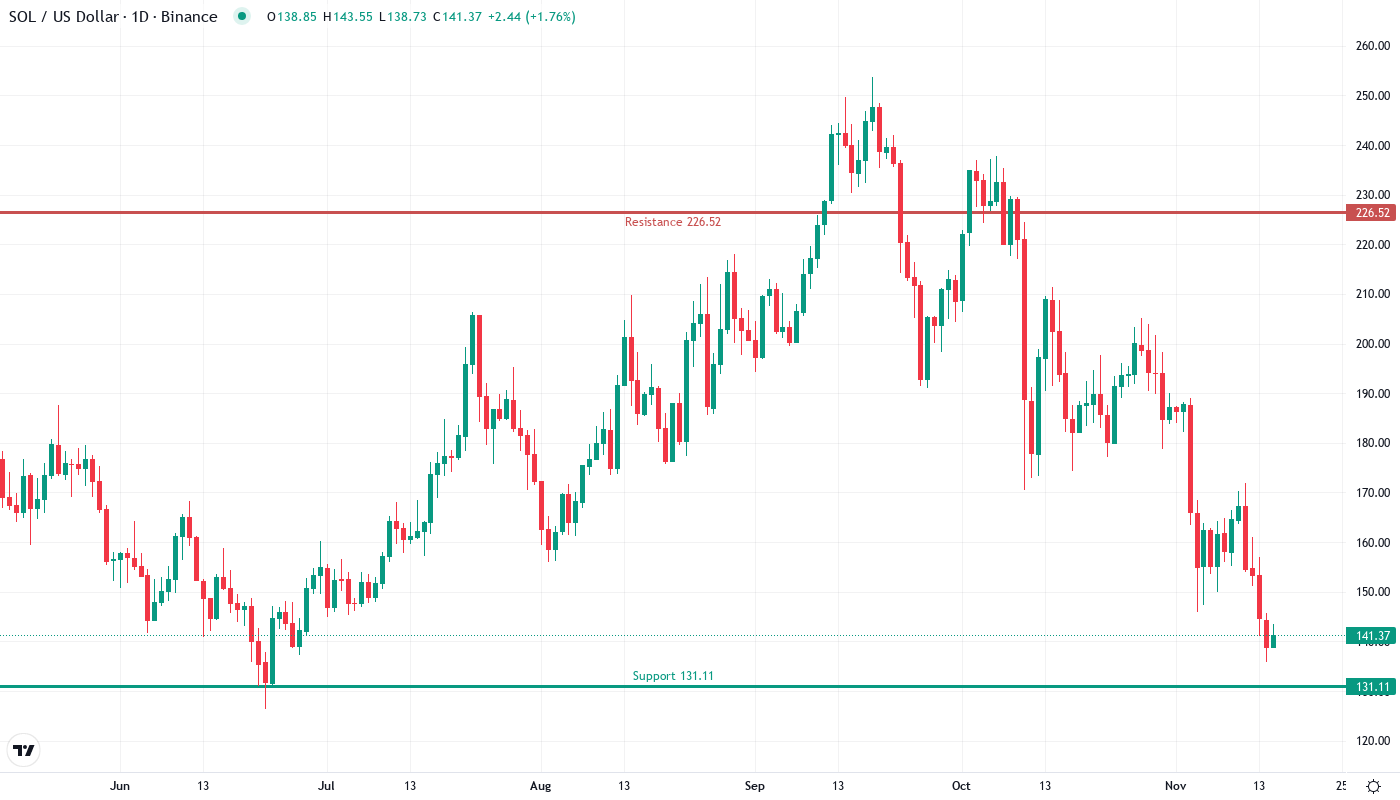
December has been a month to forget for Solana, as SOL lost 27.2% in the month’s first three sessions, slicing through various support levels on route to $135.82 – its weakest close since June. Just as interesting is that the ETF excitement that fueled November’s surge has met the technicals, with price failing the 50-day EMA on three consecutive occasions this time. The main question for VALOR-traders will be whether the upcoming ETF listing is enough bullish fuel to recapture major support levels and the 50-day EMA, or if enough damage has been done to alter the intermediate-trend.
| Metric | Value |
|---|---|
| Asset | SOLANA (SOL) |
| Current Price | $141.27 |
| Weekly Performance | -12.68% |
| Monthly Performance | -27.20% |
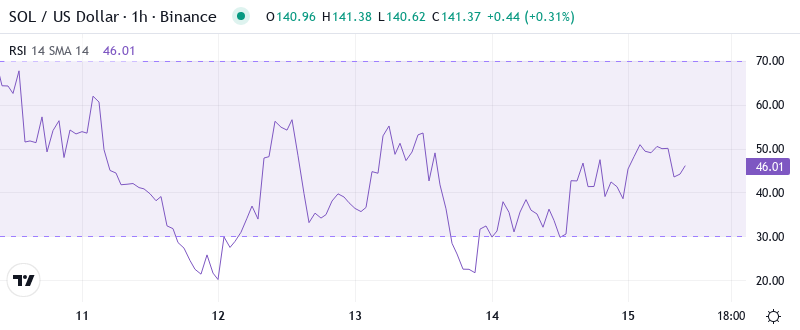
| RSI (Relative Strength Index) | 32.0 |
| ADX (Average Directional Index) | 39.9 |
| MACD (MACD Level) | -13.26 |
| CCI (Commodity Channel Index, 20-period) | -113.81 |
RSI at 32 Signals First Oversold Territory Since August Washout
Based on current daily structure, the easy go-to level would be a retest of the weekly open, marking a logical resistance-turned-support level at $120 – roughly in line with the 2021 yearly open (in red). Short-term downside remains viable based on the 4-hour blocks, with a new demand void in play until $100 – or roughly $92 from the 4-hour blocks.
Therefore, potential altcoin and Bitcoin volatility over the coming weeks suggests that this is a potential trade idea worth watching for. The reality is that in the absence of this trade setup, there’s simply not much to do from a positioning standpoint – it’s a wait and watch environment until new edges develop.
ADX Climbs to 39.94 – Trending Conditions Despite Institutional Buying
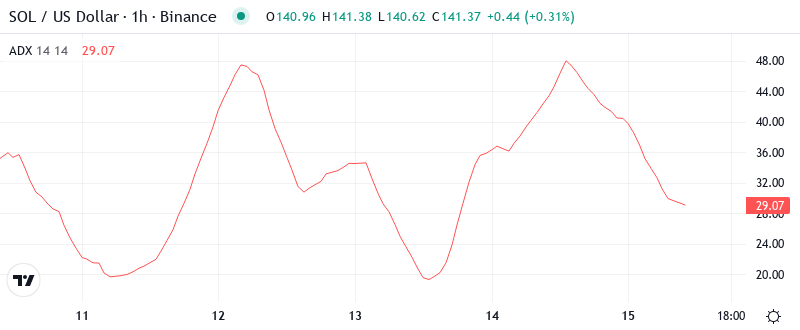
The ADX reading is at 39.94 telling us that we are in strong trending environment, rather perversely it is firmly to the down side despite the deluge of institutional newsflow around ETF launches. This inter-market divergence between the bullish fundamentals and bearish technicals perfectly illustrates how markets function. And at times, it seems that no amount of good news can overpower bad charts, especially when momentum swings to the downside in such a drastic manner. Essentially, what the ADX is showing is that the sellers are firmly in the driving seat and have the conviction, which means the longs will not in all probability work counter-trend until we move the ADX back below 30.
Hence, day traders will likely do well by focusing on lower timeframes and playing the range until the longer-term technical structure shifts. Active market participants may want to stay on the right side of the trend by continuously monitoring price action with technical tools. While it isn’t as sexy as nailing the perfect bottom, it’s considerably more profitable and a mentally healthier way to approach mean-reverting assets.
50-Day EMA at $181.51 Now Acts as Resistance Ceiling
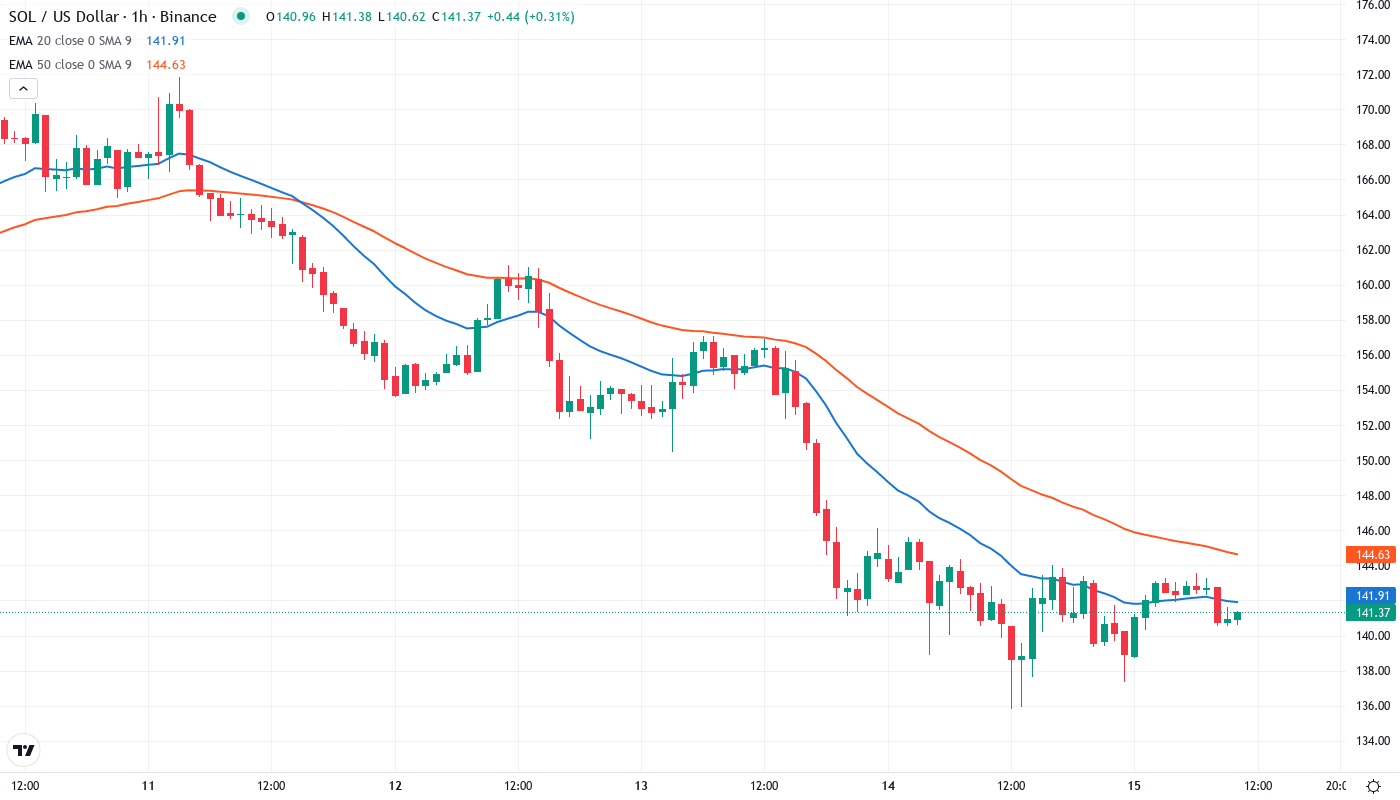
The price action is devastatingly clear through the EMA structure: SOL is trading beneath the entire ribbon, with the closest resistance being the 10-day EMA at $153.35 – $12 above. More worrying for bulls, the 50-day EMA at $181.51 has shifted from solid support during the autumn rally to strong resistance, capping three distinct recovery rallies in December before the final slide. When all moving average support is lost, it creates what traders describe as an “air pocket” – price discovery with no technical moorings.
When we take a step back and look at the weekly timeframe, the 20-week ($171.89) and 50-week ($183.20) EMAs are pinching which creates a resistance cluster in the $170-185 area and will act as a magnet for any uptrend. Generally levels like this are incredibly hard to reclaim and typically require high volume nodes, such as news, to push through. The ETF launch timeline could provide that. Until we see Elon’s 10-day EMA taken out convincingly, the technicals are firmly bearish.
December Highs at $205 Meet Institutional Interest at Current Levels
There is strong resistance overhead between the current price and the December high at $205.24. Multiple confluence zones pose as resistance. The first one is at $159.17 where the 20-day EMA coincides with the horizontal resistance of November consolidation. Sellers have been defending the $180 level aggressively as well —this zone rejected price four times post break, which implies smart money was distributing there despite the bullish ETF story.
Buyers are fiercely defending the $135.82 monthly low, which also happens to be the six-month support that was tested numerous times. The 10-day EMA must be conquered before the $158.16 weekly pivot offers itself as the first major resistance to reclaim. The most important aspect here is volume. With every rally, volume has decreased. This signals that buyers are standing aside until price action provides re-entry confirmations.
The price fluctuation between $135-159 more or less catches the price in an undefined equilibrium where there is no clear control from the bulls or the bears. The VanEck ETF deadline obviously increases the necessity for a decision, although, as usual, markets tend to shift against the most evident catalysts. When there is too much of the wrong positioning, it acts in the fashion of a spring getting compressed more and more, and the release of energy as soon as the range gives way could be extreme.
Bulls Need Volume-Backed Reclaim of $159 to Shift Momentum
Bulls need to take out $159.17 decisively on expanding volume to erase the bearish setup. In that case, the 50-day EMA at $181.51 opens up, especially if ETF approval is announced around the same time. On a breakout, $185-190 is the technical target which is where the weekly moving averages converge and should lead to long liquidation from before mentioned trapped traders.
If the price breaks the $135.82 support level with significant volume, the bears will gain the upper hand, and the price could drop to as low as $115, which is the 100-weekly MA and has not been tested since 2023. This could lead to the panic selling by the institutional investors who entered the markets in hopes of the ETF being approved and are underwater. A similar situation is observed at short-term levels where the price is facing rejection at the 10-EMA around $153.
Considering the oversold nature of the RSI, the imminent ETF news, and the multi-year support at $135, the most likely path is a relief rally to $153-159 before resuming the overall downtrend. Whether this rally will turn into an actual trend change will solely depend on reclaiming the 20-day EMA – until that happens, rallies will likely have the proverbial rug pulled from underneath them.