BNB Tests $900 Support as BlackRock Integration Fails to Spark Rally

Market Structure Shifts Lower
- BNB slides 20% from December highs despite major BlackRock partnership announcement
- Six-month support at $900 faces critical test as institutional news meets technical weakness
- Momentum indicators reset from overbought extremes, opening paths in both directions

BNB has shed nearly 20% from its December peak of $1,182, tumbling to $934 as the market digests BlackRock’s tokenized fund integration with Binance. The partnership allowing BUIDL fund tokens as trading collateral – typically bullish news for any crypto asset – arrived just as technical indicators flashed exhaustion signals. The main question for traders is: can the $900 psychological level hold despite the disconnect between fundamentally positive developments and bearish price action?
| Metric | Value |
|---|---|
| Asset | BNB (BNB) |
| Current Price | $934.10 |
| Weekly Performance | -5.71% |
| Monthly Performance | -19.75% |
| RSI (Relative Strength Index) | 37.1 |
| ADX (Average Directional Index) | 29.2 |
| MACD (MACD Level) | -43.76 |
| CCI (Commodity Channel Index, 20-period) | -85.59 |
Momentum Exhaustion at 43.26 Matches Pre-Rally Reset Zones
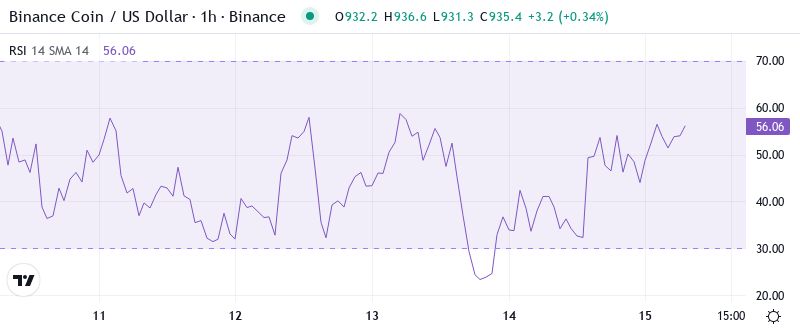
RSI sits at 43.26 on the daily timeframe, marking a sharp retreat from overbought territory above 70 just weeks ago. This reading places momentum squarely in neutral ground – neither oversold enough to trigger bounce buyers nor strong enough to sustain upward pressure. The oscillator’s behavior mirrors setups from August and October where similar resets from extremes preceded 30-40% directional moves.
What’s revealing is how RSI responded to the BlackRock news – barely budging from its downward trajectory despite the institutional validation. So for swing traders, this momentum indifference to positive catalysts suggests sellers remain in control until RSI can reclaim the 50 midpoint with conviction. The last time BNB showed this pattern of news-resistant weakness, price found a floor 25% lower.
ADX at 29.21 Confirms Trending Conditions Favor Sellers
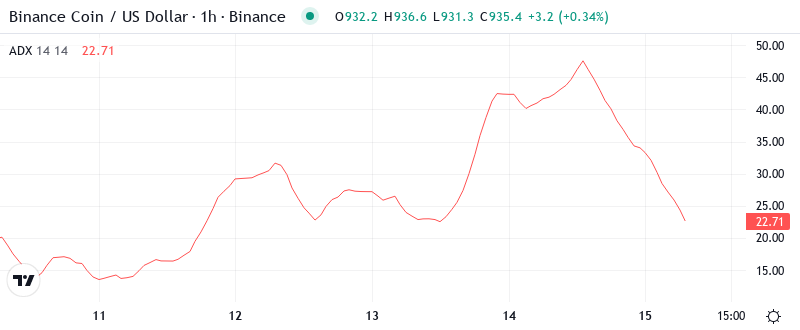
Looking at trend strength, the ADX reads 29.21, well above the 25 threshold that separates choppy markets from trending ones. This level indicates the current downmove carries genuine directional conviction rather than representing mere profit-taking or consolidation. Basically, the market has chosen its path and momentum traders should respect it.
To clarify, when ADX climbs above 25 while price declines, it signals distribution phases where rallies get sold aggressively. The BlackRock integration announcement provided a textbook example – price briefly spiked toward $980 resistance before sellers emerged with force, pushing BNB back below all major moving averages. Therefore, day traders should align strategies with this bearish trend until ADX drops below 20 or price reclaims the 50-day EMA at $1,027.
50-Day EMA at $1,027 Now Caps Rally Attempts After Support Failure
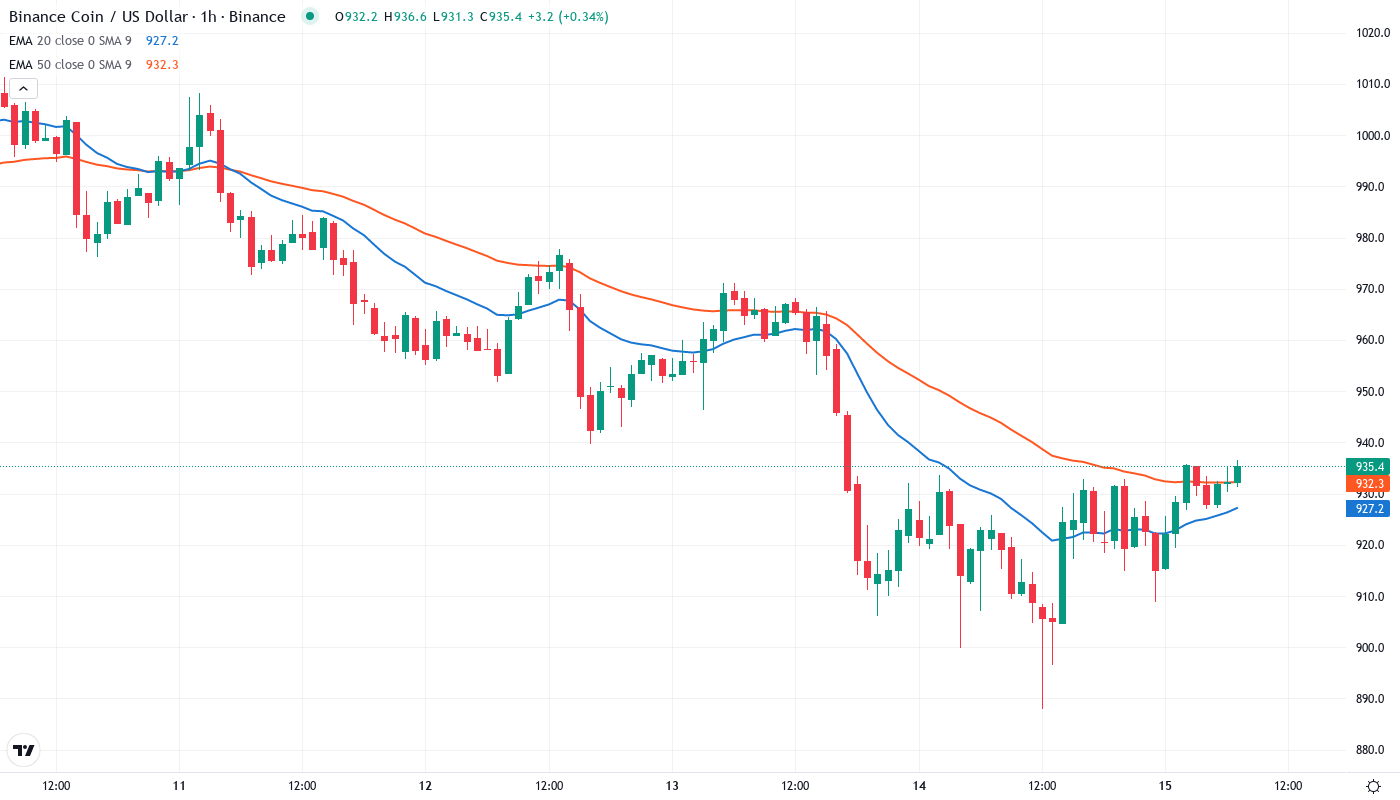
Price action tells a clear story through the EMA structure. BNB trades below the entire moving average ribbon – from the 10-day at $960 up through the 200-day at $882. Most critically, the 50-day EMA at $1,027 transformed from reliable support throughout October and November into resistance that rejected December’s rally attempt. This level rejected advances three times before finally breaking, confirming the intermediate trend shift.
The 20-day EMA at $997 provides the nearest resistance, sitting roughly 6% above current levels. Bulls managed brief reclaims during the BlackRock announcement but couldn’t hold above it for more than a few hours. That former support area between $997-1,027 now transforms into a red line that bears will likely defend on any relief bounce. Only a weekly close back above $1,027 would neutralize the bearish EMA configuration.
$900 Psychology Meets 200-Day MA in Make-or-Break Support Zone
Resistance stacks heavy between current price and the psychological $1,000 level. The immediate ceiling sits at $960 where the 10-day EMA converges with last week’s breakdown point. Above that, sellers have fortified positions at $997 (20-day EMA), $1,027 (50-day), and $1,103 (monthly R1). Even the BlackRock partnership catalyst couldn’t generate enough buying to clear these levels.
Bulls defend a more concentrated support zone between $882-906, where the 200-day EMA at $882 meets the psychological $900 level. This area has provided bounces six times since June, making it the most tested and proven support on the chart. The weekly S1 at $901 adds another layer of technical confluence to this critical zone. A break below would target the monthly S1 at $597 – a devastating 36% drop from current levels.
Market structure reveals an important detail: volume surged 18% above average during the recent decline, while the BlackRock-driven bounce saw below-average participation. This volume pattern suggests institutional distribution rather than retail panic, making the $900 support test even more crucial. The setup resembles a descending triangle with support at $900 and resistance declining from $1,182 to $1,027.
BlackRock News Creates Fade Opportunity Rather Than Breakout Catalyst
Bulls require a decisive close above $1,027 to invalidate the bearish structure. Such a move would reclaim the 50-day EMA and likely trigger short covering toward $1,103 resistance. The BlackRock ecosystem developments – including the $2.9B BUIDL fund launching on BNB Chain – provide fundamental support for an eventual recovery, but technical damage must heal first.
The bearish scenario accelerates if BNB loses $900 support on volume. This would trap recent buyers who entered on the BlackRock news between $950-980, likely triggering stop-loss cascades toward the 200-day EMA at $882. Should that final defense fail, the monthly S1 at $597 becomes a realistic target, representing a return to pre-2024 bull run levels.
Given the momentum exhaustion from overbought extremes and ADX confirming seller control, the most probable near-term path is continued pressure on $900 support. The disconnect between positive fundamental news and negative price action typically resolves lower until technical conditions improve. Traders should watch for a potential spring (false breakdown) at $882-900 before positioning for any sustainable bounce.