Ethereum Tests Critical Support as Long-Term Holders Exit Positions

Market Structure Shifts Lower
- ETH drops 20.74% monthly as 45K daily selling pressure emerges from long-term holders
- Price hovers at $3,162 after losing the psychological $3,500 level and 50-day EMA support
- Momentum indicators reset from overbought territory while ADX signals trending conditions return
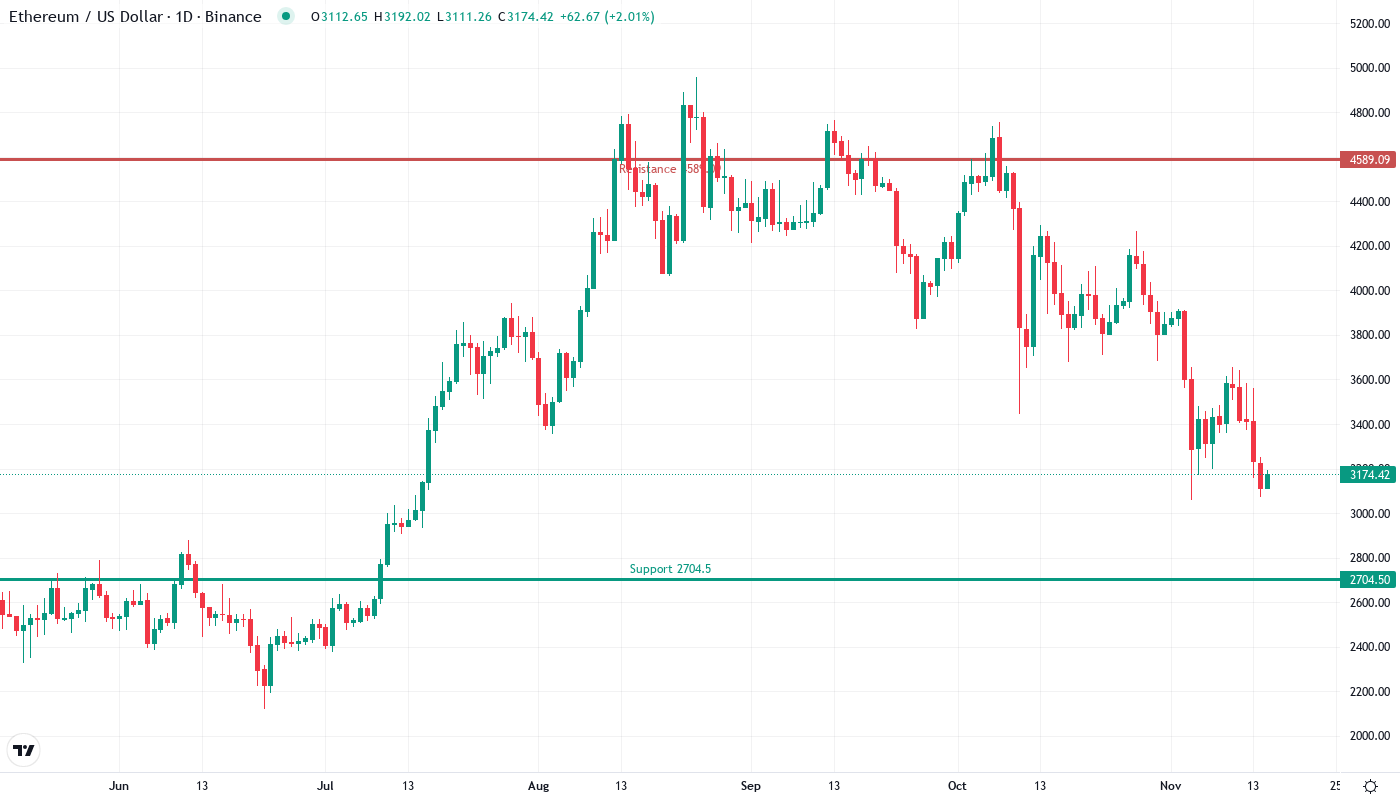
Ethereum’s price action tells a story of distribution as the second-largest cryptocurrency shed $699 from December highs, currently trading at $3,162.83. The devastating 20.74% monthly decline accelerated after reports surfaced of long-term holders dumping 45,000 ETH daily, overwhelming buying pressure that initially pushed price above $3,200 on staking optimism. The main question for traders is: will the current $3,056 support zone hold, or are we headed for a deeper correction toward $2,860?
| Metric | Value |
|---|---|
| Asset | ETHEREUM (ETH) |
| Current Price | $3162.83 |
| Weekly Performance | -7.93% |
| Monthly Performance | -20.74% |
| RSI (Relative Strength Index) | 34.3 |
| ADX (Average Directional Index) | 36.7 |
| MACD (MACD Level) | -202.13 |
| CCI (Commodity Channel Index, 20-period) | -112.30 |
Long-Term Holder Capitulation Drives Momentum Reset to 34.25
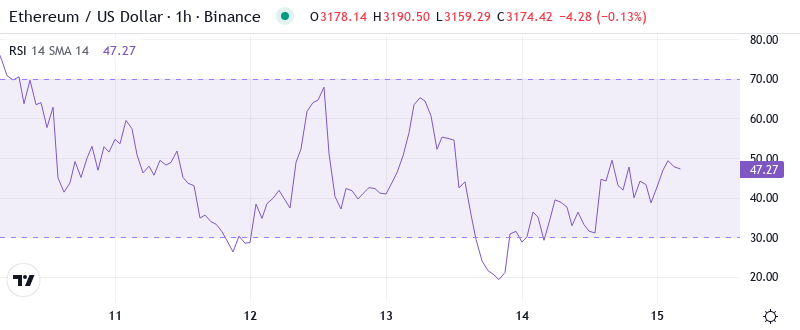
Reading the oscillator at 34.25, traders see momentum has completely reset from November’s overbought extremes above 70. This sharp decline in RSI mirrors the aggressive selling pressure from long-term holders offloading 45K ETH daily – a level of distribution not seen since the May 2022 capitulation phase. The momentum washout creates a technically oversold condition that historically preceded 15-20% relief bounces in Ethereum. What’s revealing is how RSI behaved during the selloff – it never achieved a single oversold bounce despite multiple support tests. Similar configurations in September 2023 and March 2024 marked intermediate bottoms once RSI finally stabilized in the 30-35 zone. So for swing traders, this balanced-to-oversold RSI reading suggests the selling exhaustion phase may be nearing completion, though conviction buyers remain absent.
ADX at 36.73 Confirms Mature Downtrend Seeking Exhaustion
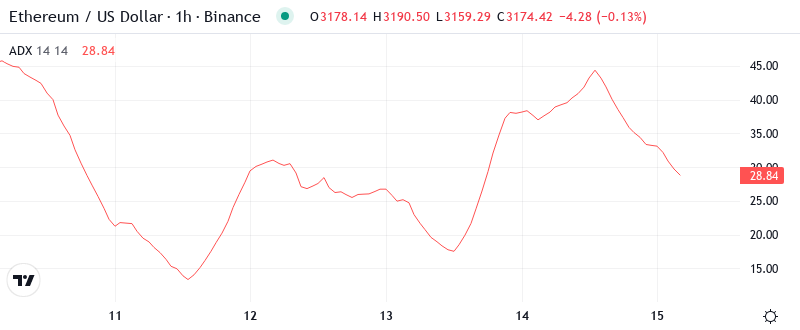
Trend strength readings show ADX climbing to 36.73, marking the shift from December’s choppy consolidation to January’s directional selling. At this level, the ADX indicates we’re in a mature trending phase where momentum traders have taken control from range traders. The acceleration from sub-20 readings in early December to current levels above 35 represents one of the sharpest trend transitions in Ethereum’s recent history. To clarify, this ADX configuration suggests the downtrend has legs but approaches historical exhaustion zones. Previous instances where ADX exceeded 35 during Ethereum corrections lasted 2-3 weeks before trend strength peaked and consolidation began. Therefore, day traders should prepare for continued directional moves in the near term while watching for ADX topping signals above 40 that would indicate trend exhaustion approaching.
20-Day EMA at $3,517 Becomes Key Resistance After Support Failure
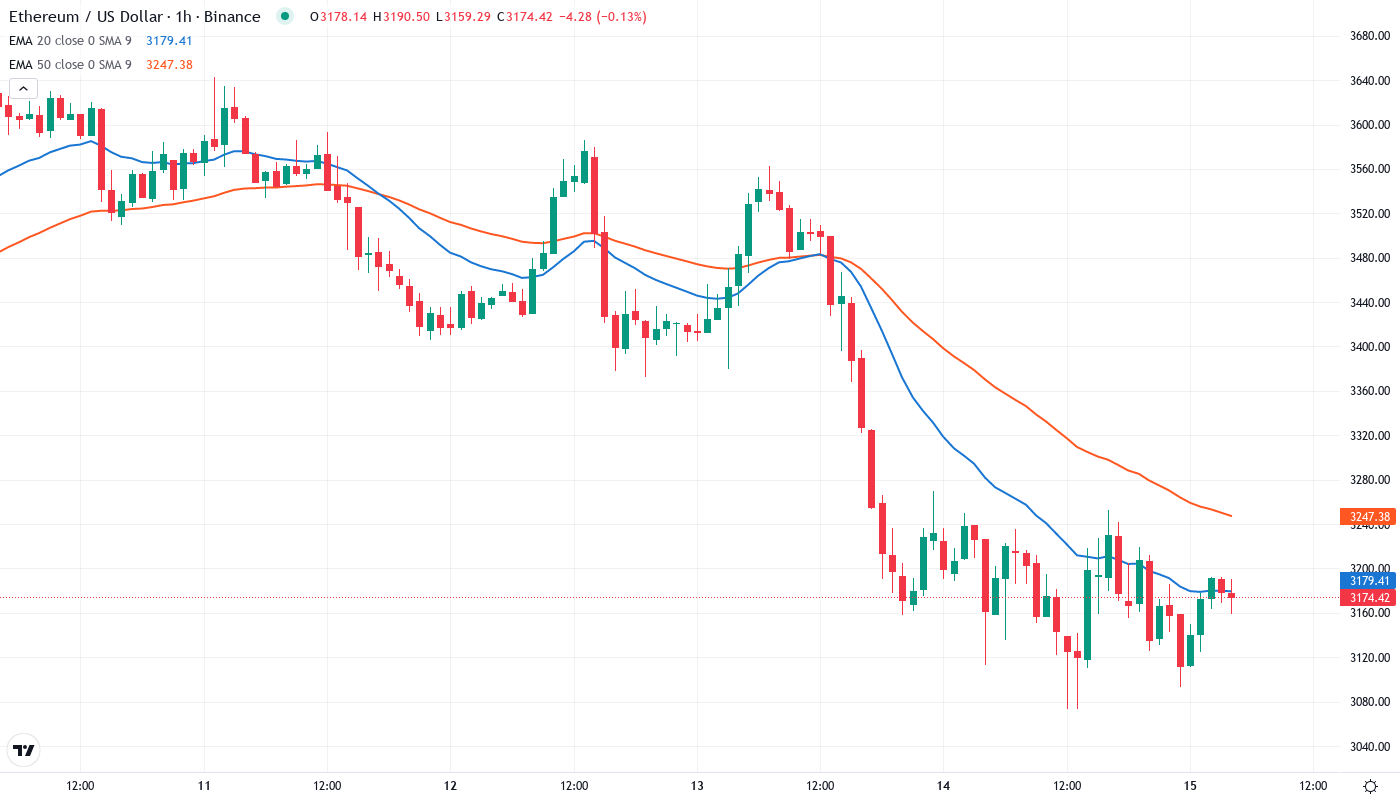
Price action through the EMA ribbons paints a bearish picture with ETH trading below all major moving averages. The critical failure came when price lost the 20-day EMA at $3,517 on heavy volume – this level that supported the November rally now caps any recovery attempts. More concerning, the 50-day EMA at $3,789 sits nearly $627 above current price, creating substantial overhead resistance that bulls must overcome.
Looking at the broader moving average structure, the bearish alignment intensified as shorter-term EMAs crossed below longer-term ones. The 10-day EMA at $3,356 attempted to provide support during the initial selloff but quickly failed as selling pressure from long-term holders overwhelmed buyers. That former support area at $3,356 now transforms into the first resistance bulls must reclaim to shift near-term structure bullish.
Resistance Stacks Heavy Between $3,356 and $3,789
Above current price, sellers have fortified multiple resistance zones that create a challenging path for any recovery attempt. The immediate resistance clusters between $3,356 (10-day EMA) and $3,517 (20-day EMA), where trapped longs from the December rally likely await exits. This zone rejected two relief attempts in the past week as selling pressure from the reported 45K daily ETH liquidations continued pressing the market lower.
Bulls defend support at $3,056 where the 100-day EMA converges with December’s consolidation lows. This level absorbed six tests over the past month, making it the most reliable support in the current structure. The psychological $3,000 level sits just below, backed by the 200-day EMA at $3,014 – a breach here would likely trigger stop-loss cascades targeting $2,860.
Market structure reveals a clear bearish bias as long as price remains below $3,517. The combination of heavy overhead resistance, persistent selling from long-term holders, and failed support levels creates a technically weak setup. However, the oversold momentum readings and approach to major support suggests downside may be limited without fresh negative catalysts.
Bulls Need Decisive Reclaim of $3,356 to Halt Decline
Should price reclaim and hold above $3,356 with conviction, bulls could mount a relief rally toward $3,517 where the 20-day EMA waits. Such a move would require the daily ETH selling pressure to subside and fresh buyers to emerge, potentially driven by positive regulatory developments or increased staking adoption that initially pushed price above $3,200.
The bearish scenario accelerates if $3,056 support breaks on volume, opening a direct path to test the 200-day EMA at $3,014. Failure there would trap recent buyers and likely trigger liquidations down to $2,860 – the next major support from October’s lows. This outcome becomes increasingly probable if the 45K daily ETH selling continues pressuring the market.
Given the technical damage and ongoing distribution from long-term holders, the most likely near-term path is continued consolidation between $3,056-$3,356 as the market digests recent selling. Watch for a decrease in daily selling volumes and ADX readings above 40 as signals the current downtrend may be exhausting, potentially setting up a relief bounce attempt.