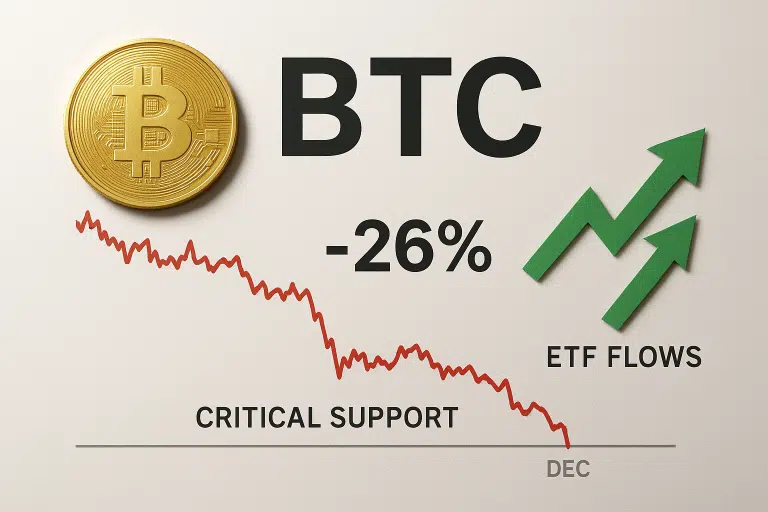
Bitcoin Tests Critical Support as ETF Outflows Accelerate Selling Pressure
Market Structure Shifts Lower
- Bitcoin’s price dropped by 7% last week due to institutional selling and $502.7 M ETF outflows below $100,000.
- Bulls are defending critical support at $95,954, having earlier held the monthly floor at $93,942.
- ETF outflows suggest primary market makers may have sold into new demand, creating additional selling pressure.
Bitcoin’s price dropped by 7% in the past week due to increased institutional selling pressure. ETF outflows of $502.7 million led to automatic sell-offs below the $100,000 level. Currently, the bulls are trying to protect the higher lows at $95,954. They previously defended the monthly floor at $93,942.
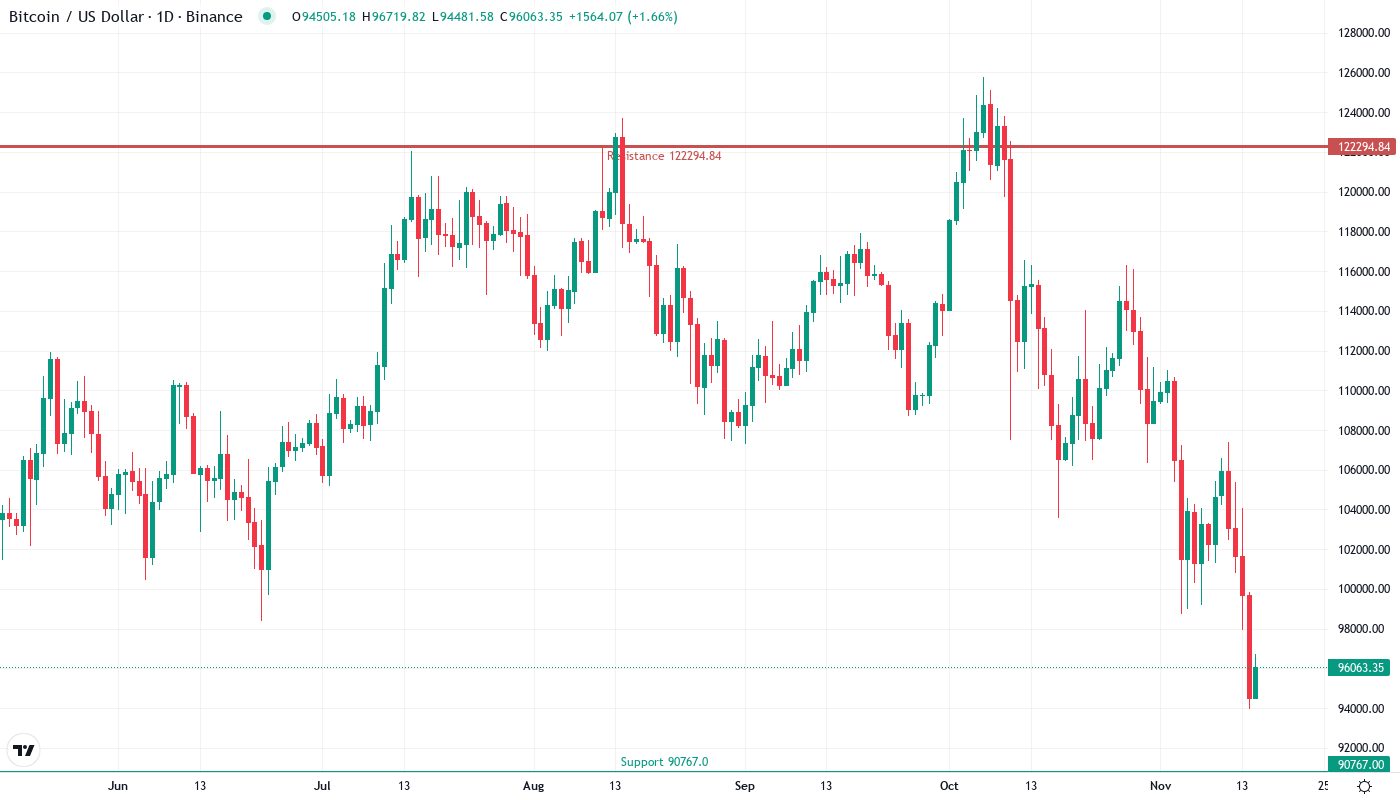
Bitcoin has been significantly influenced by institutional flows. The price range did see some distribution earlier in the week when an almost full coincidence of BlackRock‐led ETF outflows hit the markets—which totaled $502.7 million. Bitcoin’s higher‐range prices paired with the withdrawals right near the local top suggest that even a fraction of those ETF shares turned over right back to primary market maker and the leverage desk. A scenario where the primary was either not long or net neutral on exposure to Bitcoin and had to sell into new demand could have created some selling pressure. The result was a test of the $95,000 cluster, which merges the .786 Fibonacci retrace of the latest five‐wave advance with the .382 Fibonacci retrace of waves two and three. The retest looks to be in play as of Monday; however, bulls are defending that level as seen by the two daily closes just above the cluster. The market was ripe for it also, with the funding rate on many exchanges growing negative and futures carrying a discount far greater than the cost to borrow on the CME. It wouldn’t hurt longs at all to reposition their leverage, particularly so with many going into the weekend overleveraged in expectation of a break to the upside.
| Metric | Value |
|---|---|
| Asset | BITCOIN (BTC) |
| Current Price | $95954.16 |
| Weekly Performance | -7.06% |
| Monthly Performance | -13.39% |
| RSI (Relative Strength Index) | 33.2 |
| ADX (Average Directional Index) | 32.0 |
| MACD (MACD Level) | -3583.69 |
| CCI (Commodity Channel Index, 20-period) | -146.46 |
RSI at 37.73 Signals First Oversold Territory Since October Washout
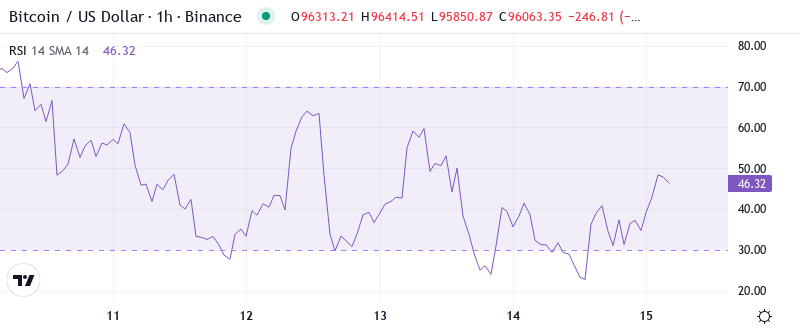
By reading the oscillator at 37.73 on the daily timeframe, momentum is nearing capitulation levels that haven’t been seen since the broad October selloff. Comparable RSI setups early Q4 2024 lead to 15–20% relief rallies, although the present ETF outflow situation presents an additional factor to previous comparisons.
Therefore, in my opinion, the odds of a bounce reaction are higher than an immediate breakdown, so I readjust the trade. The bulls are watching if this daily counter-trend bull flag here within the daily uptrend support can get their momentum back this morning, and see if they can get a move back to test and likely break to higher highs.
ADX Climbs to 31.98 – Sellers Take Control of Trending Conditions
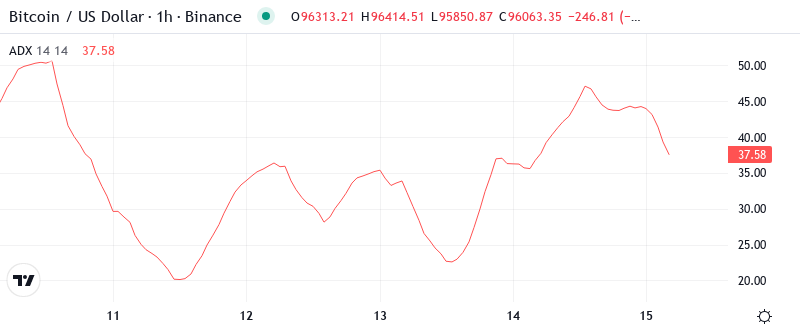
Trend strength indicators indicate strong conviction in this direction as ADX reached 31.98, the highest since the November downturn. The transition from the erratic consolidation in December to the downward trend in January was quick, and many expected a year-end rally.
So, day traders are better off adjusting and looking for potential short entries but combining the 15- to 200-day EMA rally as a fundamental overview of how the evolving trend strength could be impacting the day trading area.
20-Day EMA at $103,765 Becomes Key Resistance After Support Failure
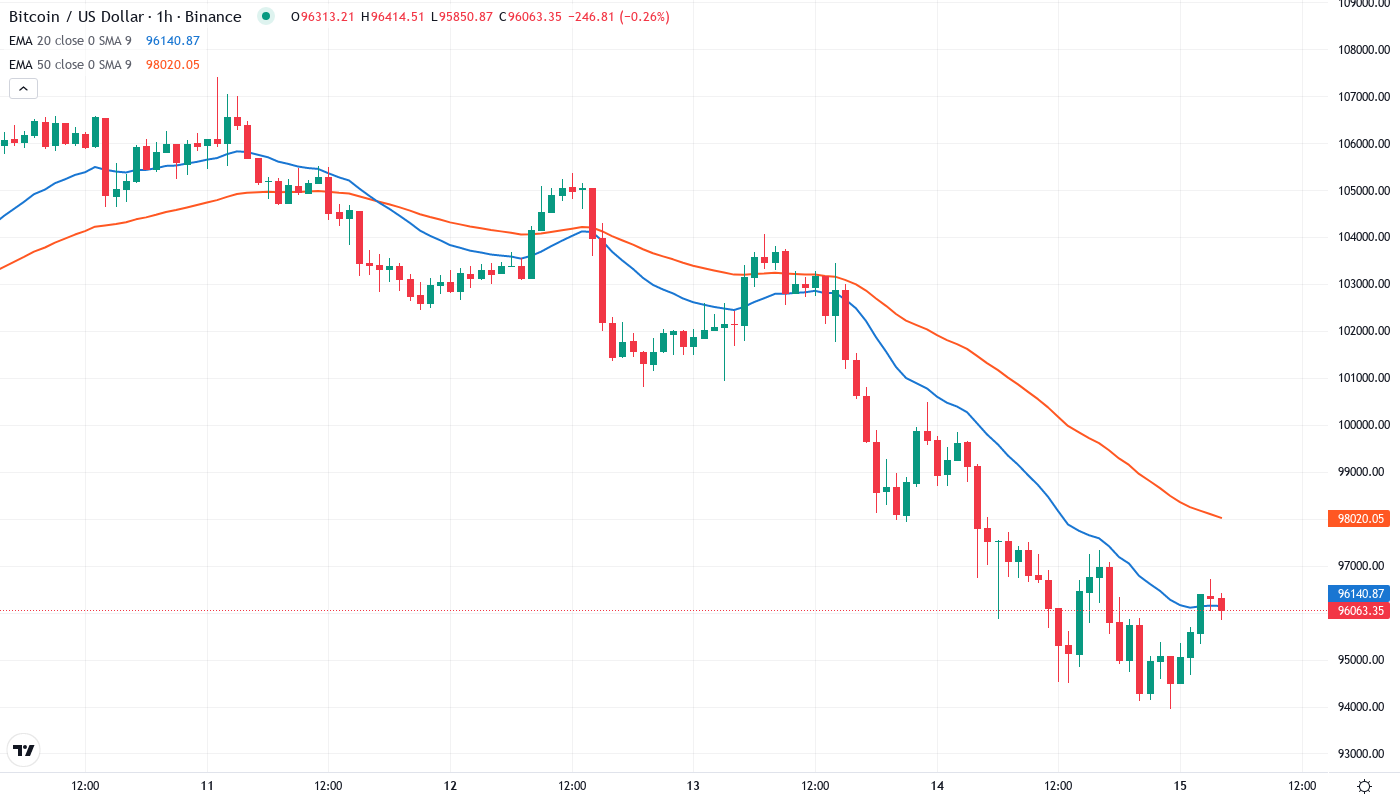
Examining the moving average cross-section shows the speed with which Bitcoin’s technicals turned for the worse. Price currently resides well below the entire EMA ribbon—entangled within the 10-day ($100,743), 20-day ($103,765), and, most importantly, the 50-day EMA at $108,189. Last month saw the exact opposite occur, where those identical averages held as solid support on each retest. What is most informative is that the 20-day EMA repelled price twice this week, solidifying the shift from support to resistance. The 100-day EMA at $110,006 is now a long way off overhead impediment, with the 200-day EMA at $107,595 capping any rebound in the medium term. To reestablish positive momentum, the bulls must take back at least the 50-day EMA.
Resistance Wall Builds From $100K Round Number to $110K EMA Cluster
Sellers have placed defenses at several key levels above the prevailing market price. The immediate psychological resistance at $100,000 is reinforced by the 10-day EMA, which led to two intraday rejections earlier this week. Above this point, the 100-day EMA near $110,006 and the monthly pivot at $109,851 are expected to act as substantial resistance levels for any potential relief rally. Bulls have a stronger floor to stand on courtesy of December building a base of support. The $95,954 level has held for the third time since being swept on the ETF news on Monday, with the monthly S1 right below that at $90,767. Most importantly, the $93,942 monthly low is the line in the sand—lose that level and there’s a gap lower to the $81,694 weekly S2. The market structure is showing an interesting split between institutional outflows and sovereign accumulation. Retail-facing ETFs are seeing massive outflows while central banks like the Czech National Bank are starting to accumulate, likely different timeframes at work. These setups usually end with a final capitulation wick in the opposite direction.
ETF Dynamics Create Binary Setup at $95K Support
If bears take over, Bitcoin could drop to the sub-$100K zone and revisit the $79,927 level where the recent uptrend began. The fear and greed index at .57 reflects caution rather than fear and points to a buy-the-dip scenario. Bitcoin has corrected four pullbacks and is +25% in May. If the support at $95,954 is broken, it would activate the bearish scenario, and with the increase in volume, it would probably force those who took on a lot of long positions to sell, bringing the price down to $90,767, which is the location of the monthly S1. This would result in recent dip investors getting stuck and the price potentially falling to $90,000, which is psychologically significant and where there have traditionally been institutional buyers. The daily relative strength index has become oversold, indicating a local bottom could be in given the overall strong uptrend with the ADX trading near the highest we’ve seen for 2022. Inflows continue to outpace outflows, which is evidence of distribution in my opinion, but for now price has stopped responding. The most likely range over the near term is $93,942 to $100,743. This range will likely be in play until the door-to-door ETF sellers finish their business. A momentum divergence on a retest of support would signal exhaustion and set up the next directional trade.