Ondo Price Slides 28% as Bulls Guard Critical Support at $0.58

Market Structure Shifts Lower
- ONDO shed 27.6% over the past month, erasing November gains
- Bulls defend six-month support zone between $0.55-$0.58
- ADX climbs above 40, signaling mature downtrend nearing exhaustion
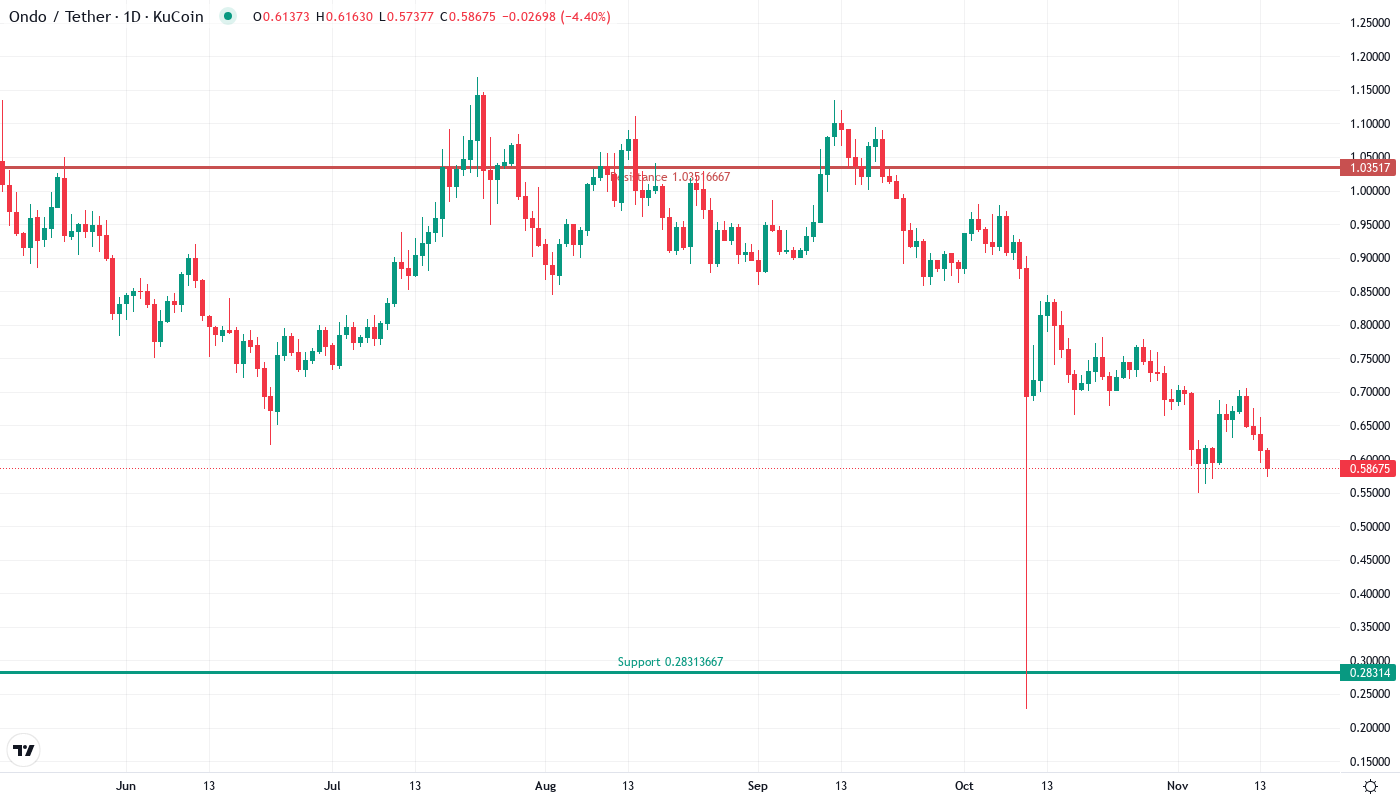
ONDO has taken the elevator down this month, tumbling 27.6% from $0.80 to current levels near $0.58 as sellers overwhelmed any attempt at recovery. The token now tests critical support that held throughout 2024, with bulls mounting their sixth defense of the $0.55-$0.58 zone since June. The main question for traders is: will this historically reliable floor hold once more, or are we witnessing the setup for a deeper flush toward $0.40?
| Metric | Value |
|---|---|
| Asset | ONDO (ONDO) |
| Current Price | $0.58 |
| Weekly Performance | -2.74% |
| Monthly Performance | -27.64% |
| RSI (Relative Strength Index) | 34.8 |
| ADX (Average Directional Index) | 42.6 |
| MACD (MACD Level) | -0.04 |
| CCI (Commodity Channel Index, 20-period) | -121.29 |
Momentum Exhaustion Signals Capitulation Phase Complete
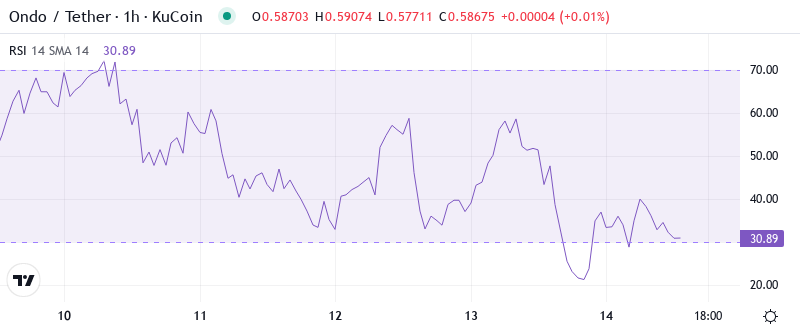
RSI reads 34.79 on the daily timeframe, marking the first oversold condition since the August washout that preceded a 45% rally. What’s revealing is how momentum indicators across multiple timeframes have converged into oversold territory – the weekly RSI sits at 35.51 while the monthly prints 51.63, suggesting shorter-term capitulation within a longer-term neutral structure.
Historically, such extreme RSI compressions below 35 have marked significant bottoms for ONDO. The September reading of 32 kicked off a surge to $0.95, while May’s dip to 28 launched the move above $1.20. So for swing traders, this oversold bounce setup offers compelling risk-reward, especially with the SEC registration news providing fundamental backing for any technical reversal.
ADX Above 42 Confirms Mature Downtrend Ready to Reverse
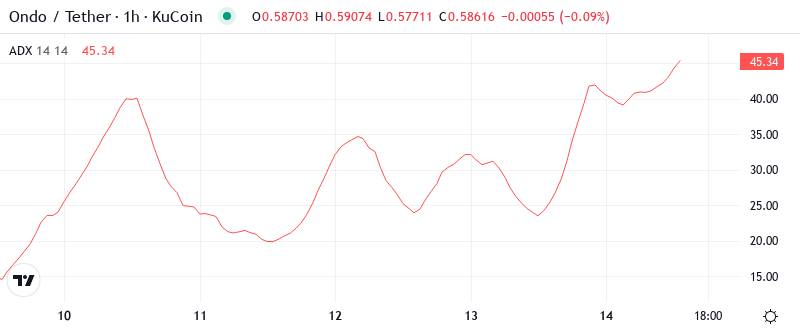
Trend strength indicators flash extreme readings with ADX climbing to 42.59 – the highest level since ONDO’s initial listing volatility. At these levels, the ADX indicates we’re deep into a mature trending move where exhaustion typically emerges. The +DI at 12.28 versus -DI at 31.57 confirms sellers maintain control, but such lopsided readings often mark the final capitulation before trend reversal. To clarify, when ADX pushes above 40 with such extreme directional divergence, it signals the trending move has likely run its course. Day traders should prepare for either a sharp reversal or extended sideways consolidation as the market digests this month’s damage. The combination of oversold RSI and extreme ADX creates conditions where counter-trend bounces can be violent.
50-Day EMA at $0.74 Becomes First Major Resistance Target

Moving average structure tells a clear story of deterioration. ONDO trades well below the entire EMA ribbon, with the 10-day EMA at $0.637 providing immediate overhead resistance. More significantly, the 20-day ($0.665) and 50-day ($0.744) EMAs have rolled over and point lower, confirming the intermediate downtrend remains intact despite oversold conditions.
Resistance Layers Stack Between $0.637 and $0.80
Above current levels, sellers have fortified multiple resistance zones that coincide with recent breakdown points. The immediate ceiling sits at $0.637 where the 10-day EMA converges with last week’s rejection highs. Beyond that, the $0.665-$0.698 zone houses both the 20-day and 30-day EMAs along with the psychological round number at $0.70 that rejected advances three times in December.
Support architecture looks more promising with the $0.549-$0.58 zone proving its reliability once again. This level has attracted buyers six times since June, with each test accompanied by increasing volume. The monthly low at $0.549 marks the absolute line in the sand – a break below would trigger stops and likely accelerate the decline toward the 200-day EMA at $0.873 (note: this appears to be a data error as the 200-day should be below current price in a downtrend).
The market structure reveals an interesting divergence between price action and the fundamental developments around ONDO’s SEC registration achievement. While technicals paint a bearish picture, the disconnect between negative price action and positive regulatory progress suggests this could be a shakeout before the next leg higher rather than the start of a deeper bear trend.
Bulls Need Reversal Confirmation Above $0.637 to Shift Momentum
Recovery requires a decisive close above the 10-day EMA at $0.637 with expanding volume to confirm the oversold bounce has legs. Such a move would target the $0.70 psychological level where the 30-day EMA waits, potentially setting up a measured move back toward $0.80 if the SEC registration catalyst gains traction with institutional players.
Bears maintain control as long as price remains below $0.637 on any bounce attempt. The nightmare scenario unfolds if $0.549 support cracks – this would likely trigger a liquidity cascade targeting the next major support near $0.40, essentially giving back all gains since the October accumulation phase.
Given the extreme oversold readings, mature downtrend exhaustion signals, and positive fundamental catalyst from SEC registration, the highest probability near-term path points to a relief bounce toward the $0.665-$0.70 resistance zone before the market decides whether this month’s selloff marked a major bottom or merely a pause in the larger decline.