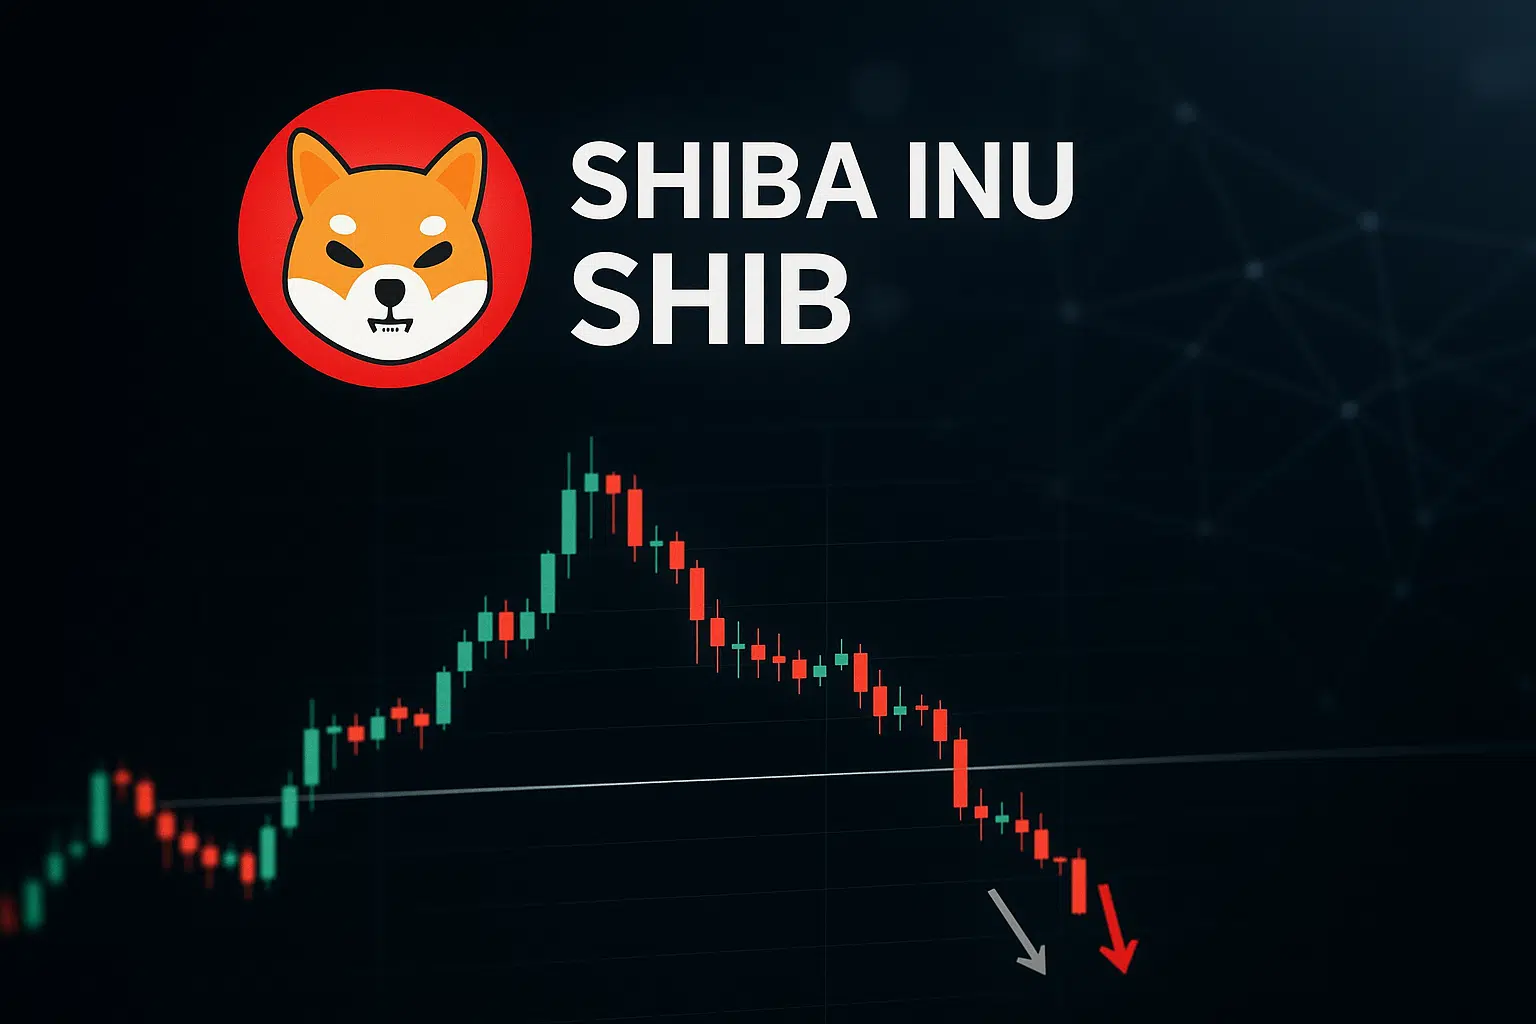
Shiba Inu Tests Critical Support as Unity Partnership Expands Real-World Utility
Market Structure Shifts Lower
- Shiba Inu (SHIB) has lost 14.3% over the past week
- Heading for the fifth straight daily decline below the 100-day simple moving average on the four-hour chart
- Currently trading at $0.00000929 after it was rejected from the monthly high of $0.00001109
The Shiba Inu token is at an inflection point with technical weakness coming to the fore, but some fund managers believe there is a price floor given the increased scope for utility unlocked by Unity Nodes.
| Metric | Value |
|---|---|
| Asset | SHIBA INU (SHIB) |
| Current Price | $0.00 |
| Weekly Performance | 2.11% |
| Monthly Performance | -14.33% |
| RSI (Relative Strength Index) | 40.0 |
| ADX (Average Directional Index) | 29.5 |
| MACD (MACD Level) | 0.00 |
| CCI (Commodity Channel Index, 20-period) | -101.83 |
Momentum Exhaustion Signals Potential Bottom Formation
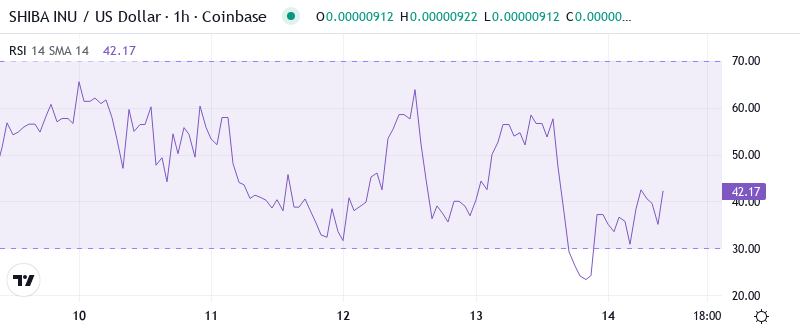
With the oscillator at 39.96, momentum is in oversold territory for the first time since the November washout. This has historically been a capitulation zone where selling pressure exhausts itself – similar RSI setups in September and early November led to 20-30% relief rally’s within days.
The fact that RSI held steady when Unity Nodes news was released, there was almost no change even with the fundamental news. It likely means that swing traders will have to wait a little longer for the telecom utility narrative to percolate through before we get a more positive momentum swing. But that relief bounce could prove more powerful than expected with it likely to be directly proportional to the negativity built in.
ADX at 29.5 Confirms Trending Conditions Remain Active
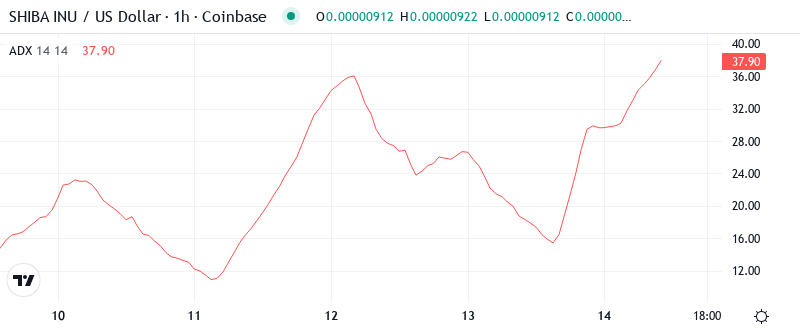
The current trend strength readings show that ADX (Average Directional Index) is at 29.5, which is relatively higher than the threshold level of 25 indicating a trending market as opposed to a choppy market. It’s more of a real move than meaningless up and down movements, and that move is to the downside.
In October and December, SHIB oscillated in a similar sideways channel before breaking down around the third week of the month and extending losses sharply for a week. Given ADX and patterns, this is the more likely outcome if buyers fail to jump in.
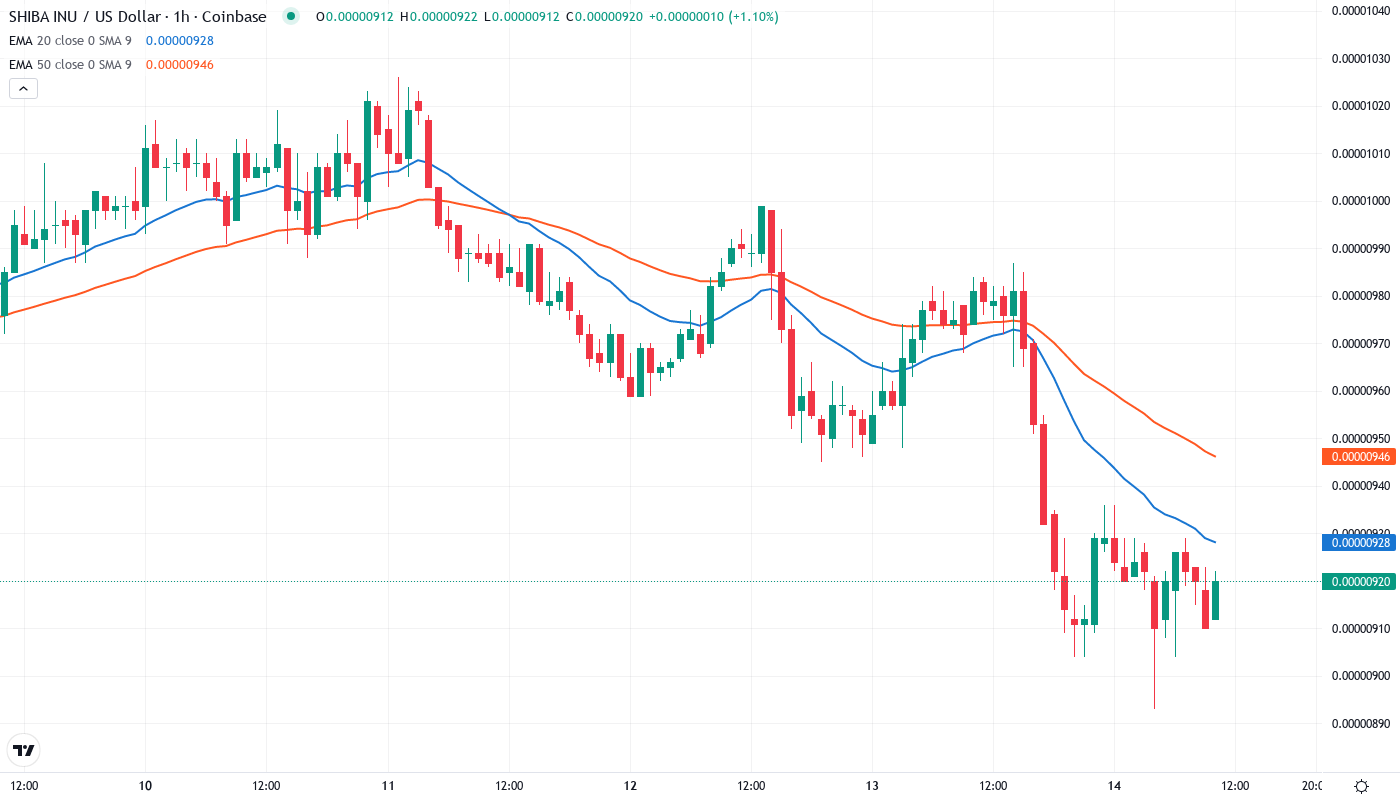
20-Day EMA at $0.00000977 Now Acts as Dynamic Resistance
The prevailing downtrend is reinforced by the downward-sloping gain and loss oscillators, which identify a minimal presence of buyers and a robust contingent of sellers. If the 10-day EMA is breached, the loss of downside control will likely materialize in the 50-day EMA at $0.00000657 and, subsequently, the 200-day EMA at $0.00000221.
What is most telling is the compression between the 50-day ($0.00001048) and 100-day ($0.00001130) EMAs over price right now. Generally, two of these three moving averages will be tested following a move to an extreme before a reverse occurs. This means a price push will be made before concrete direction can be determined. The announcement of the Unity Nodes partnership was not enough to stop the EMA breakdown; so it seems technical matters are in the driving seat compared to fundamentals.
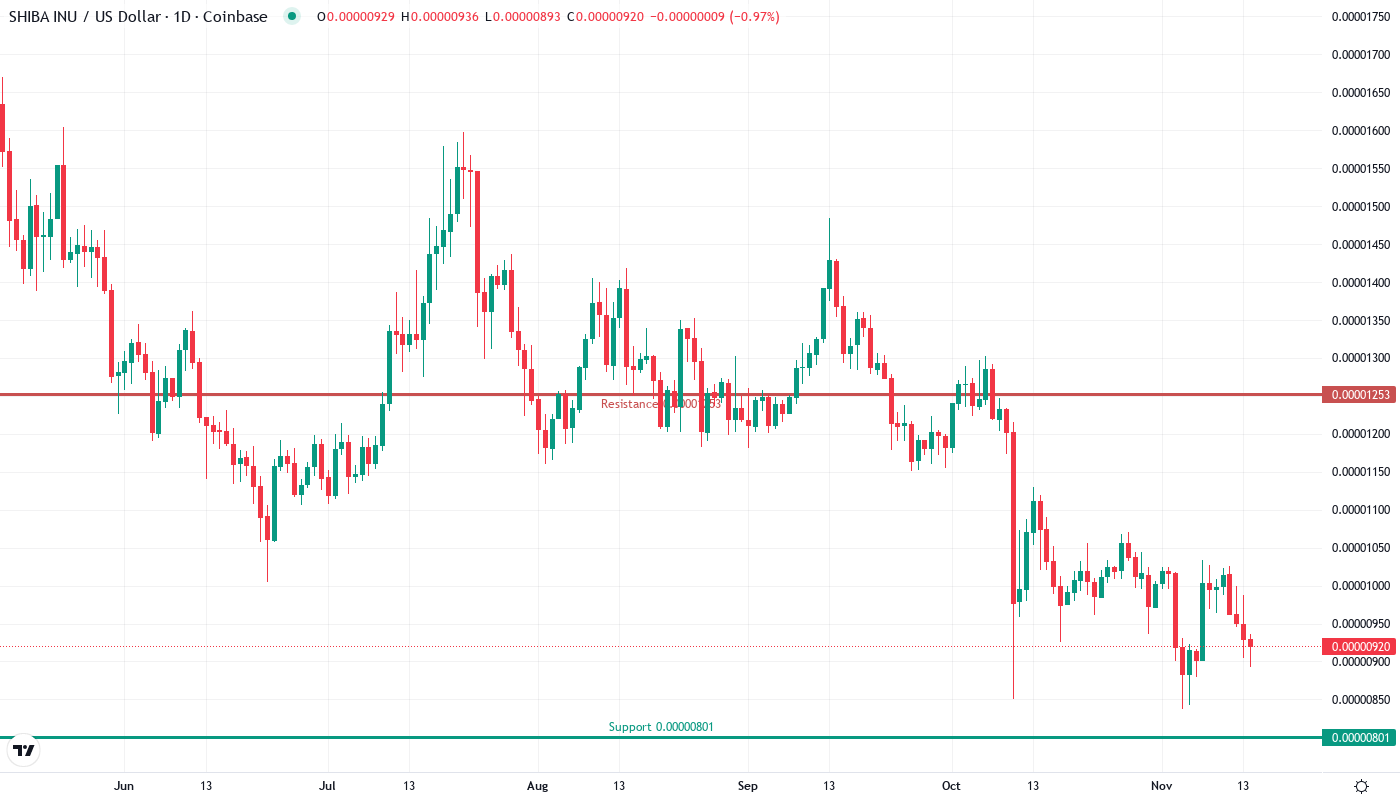
Support at $0.00000800 Becomes Make-or-Break Level for Bulls
There is a strong resistance between $0.00000957 and $0.00001001, as the 10-day EMA coincides with the psychological round level. Moreover, the double top pattern from December highs, which were close to $0.00001070, will continue to limit the extent of any advances.
Buyers made an effort to drive the price back up above the $0.00000921 level, but sellers quickly stepped in and pushed the price back down. The key level to watch remains $0.00000800, as a break below that could lead to further downside and test the yearly lows around $0.00000667. This level has served as strong support in the past, so it will be interesting to see if buyers defend it again.
The market structure delineates a contradiction between organic development and artificial crack. The telecom utility build-out via Unity Nodes is a real step forward from meme-hood. But, the price discovery process indicates that this information is not yet fully priced in, or that investors need more time to accumulate before market-making participants turn the liquidity knob.
Bulls Need Reclaim of 20-Day EMA to Shift Momentum
If SHIB is able to take back the 20-day EMA at $0.00000977, there is likely to be enough momentum to carry it to the 50-day at $0.00001048. The Unity deal is the kind of fundamental catalyst that could drive this movement, and adoption statistics from the telecoms integration could help.
If prices hit those lows there’ll be a good chunk of the XVX market that’s underwater. With less than two months until the VeADIR alpha is over it’s a crucial period for their development team to start staking integration.
Based on the oversold RSI, trending ADX conditions, and how close we are to major support, the most likely short-term scenario is a relief bounce to the 10-day EMA at $0.00000957 as the market determines if the Unity Nodes utility narrative has the juice to fuel an actual trend change. The next day or two will let us know if $0.00000921 serves as a springboard or gets taken out as a trapdoor.