XLM Tests Critical Support as Cross-Chain Integration Fuels Recovery Hopes
Market Structure Shifts Higher
- Cross-chain swaps launch via THORWallet-NEAR brings fresh utility to Stellar ecosystem
- RSI at 36.46 signals oversold bounce potential after 21% monthly decline
- Support at $0.254 holds firm despite broader crypto market pressure
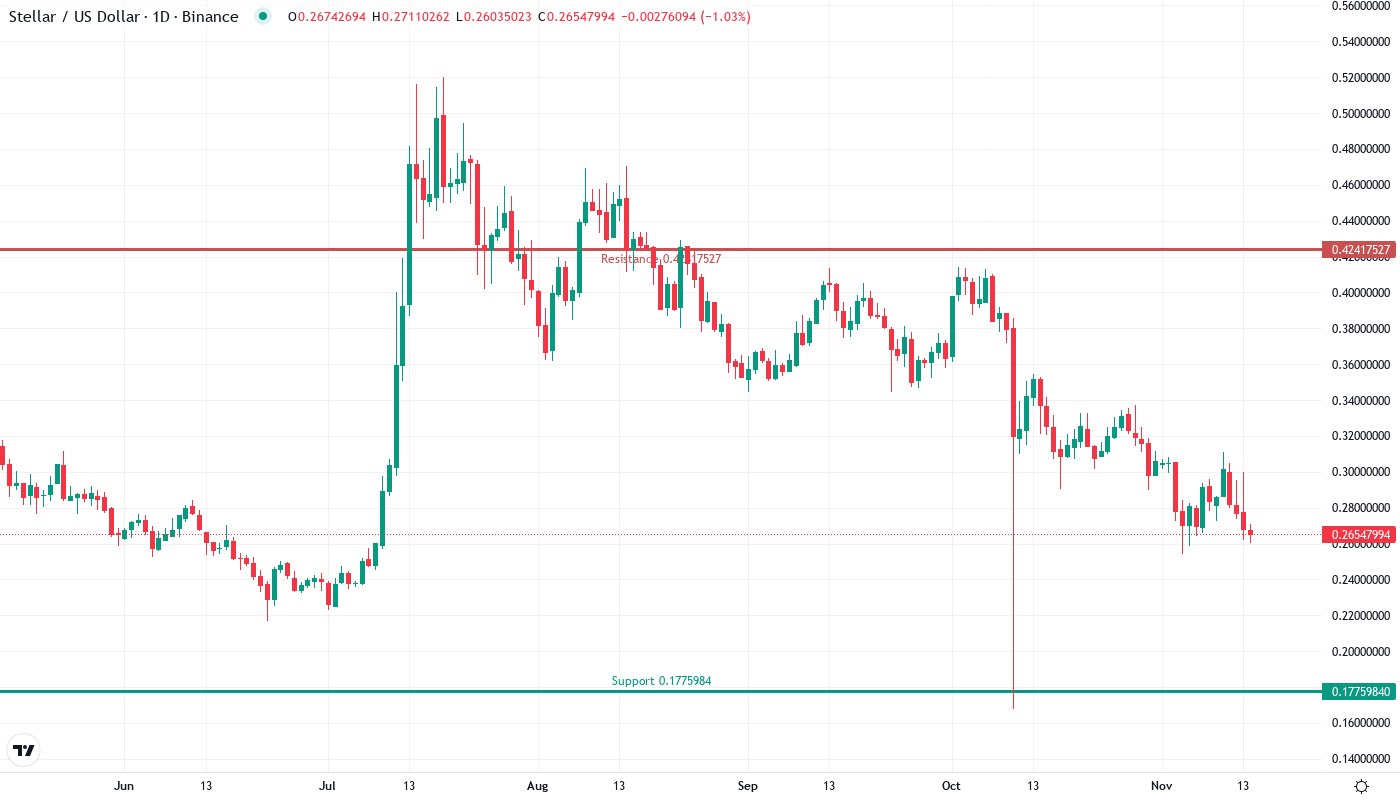
Stellar’s native token XLM trades at $0.265, nursing a 21.3% monthly decline that pushed the asset into oversold territory for the first time since August. The recent launch of THORWallet’s cross-chain swap functionality powered by NEAR Intents arrived just as XLM tested critical support at $0.254, sparking a relief bounce that has traders eyeing a potential recovery. The main question for traders is: can this newfound utility through cross-chain integration and tokenized finance partnerships provide enough momentum to reverse the bearish trend?
| Metric | Value |
|---|---|
| Asset | STELLAR (XLM) |
| Current Price | $0.26 |
| Weekly Performance | -1.70% |
| Monthly Performance | -21.31% |
| RSI (Relative Strength Index) | 36.5 |
| ADX (Average Directional Index) | 46.0 |
| MACD (MACD Level) | -0.02 |
| CCI (Commodity Channel Index, 20-period) | -113.58 |
RSI at 36.46 Matches August’s Pre-Rally Configuration
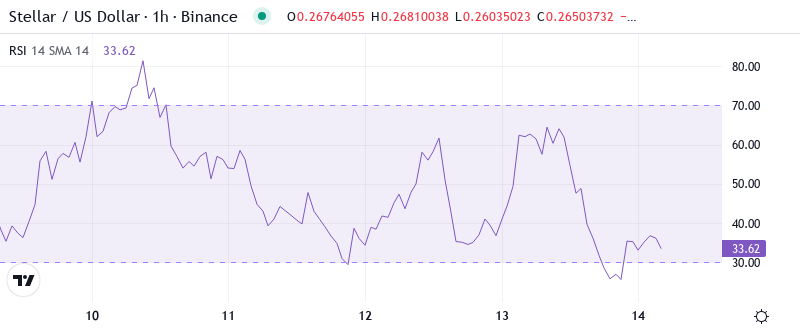
Reading the oscillator at 36.46 on the daily timeframe reveals XLM has entered oversold conditions that historically mark local bottoms. Similar RSI configurations in August preceded a 40% surge over the following three weeks, though that move came with stronger volume confirmation. The THORWallet integration timing looks particularly interesting here – launching cross-chain swaps just as momentum indicators flash capitulation often creates the liquidity injection needed for trend reversals.
What’s revealing is how RSI behaved during the decline from December’s $0.337 peak. Unlike the violent flush to 27 we saw in June, this descent showed measured selling with RSI grinding lower rather than spiking down. So for swing traders, this controlled retreat into oversold territory suggests accumulation rather than panic selling, especially with Spain’s Turbo Energy announcing their debt tokenization pilot on Stellar during the same period.
ADX at 46.04 Signals Mature Downtrend Nearing Exhaustion

Trend strength readings paint a picture of conviction behind the recent selling, with ADX climbing to 46.04 – marking one of the strongest directional moves of 2024. At the level of 46.04, the ADX entry indicates that while the downtrend has been powerful, we’re approaching historically extreme readings where reversals become more probable. Basically, when ADX pushes above 45, it often signals trend exhaustion rather than continuation, particularly when combined with oversold momentum indicators.
The shift in market dynamics becomes clearer when examining the broader context. December’s rally pushed ADX above 40 in the opposite direction, and that uptrend exhausted near current levels. To clarify, the ADX is indicating that sellers have pushed about as hard as they typically can before profit-taking emerges. Therefore, day traders should prepare for increased volatility as the trending conditions that favored short positions give way to potential two-way action, especially with multiple Stellar ecosystem developments providing fundamental catalysts.
20-Day EMA at $0.292 Becomes First Resistance Target
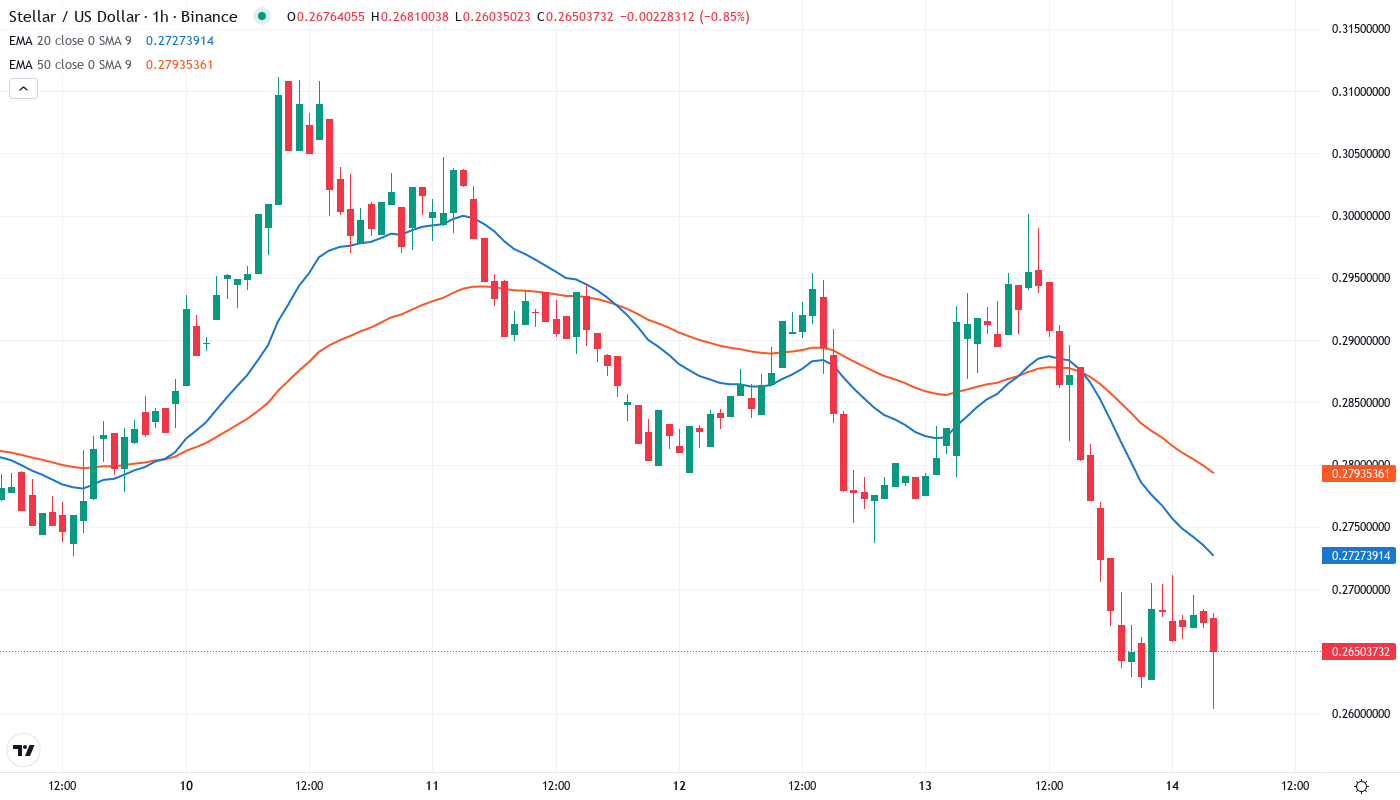
Price action through the EMA ribbons tells a story of bears maintaining control but facing increasing pushback. XLM currently trades below all major moving averages, with the 10-day EMA at $0.281 providing immediate overhead resistance. The 20-day EMA at $0.292 looms as the more significant barrier – this level rejected advances twice last week before the Turbo Energy announcement sparked renewed buying interest.
Looking at the longer-term averages reveals the extent of technical damage. The 50-day EMA sits at $0.302, roughly 14% above current prices, while the 200-day EMA at $0.337 coincides with December’s peak. That former support area at $0.302 now transforms into a red line for bears to defend. Should XLM reclaim the 20-day EMA convincingly, it would mark the first positive technical development since mid-December and potentially trigger a squeeze toward the 50-day.
Support at $0.254 Proves Resilient Through Multiple Tests
The immediate support zone from $0.254 to $0.260 has emerged as the battlefield where bulls make their stand. This area has been tested six times since late December, with each touch accompanied by increasing volume as buyers defend the level. The confluence of the monthly S1 pivot at $0.258 with horizontal support from June’s accumulation zone creates a formidable floor that bears have struggled to break despite the 21% monthly decline.
Above current prices, sellers have stacked resistance between $0.292 (20-day EMA) and $0.302 (50-day EMA and psychological round number). The December highs at $0.337 remain distant but would likely attract significant selling pressure should momentum shift. Interestingly, the weekly pivot at $0.294 sits right between these EMA levels, creating a clear demarcation zone for trend determination.
Market structure reveals an intriguing setup developing. The series of higher lows on the hourly timeframe since the THORWallet announcement contrasts with the daily downtrend, suggesting accumulation beneath the surface. This divergence often precedes trend reversals, particularly when combined with oversold conditions and fundamental catalysts like the expanding tokenization initiatives on Stellar.
Bulls Need Sustained Close Above $0.292 to Confirm Reversal
Bulls require a decisive close above the 20-day EMA at $0.292 to signal the downtrend has exhausted. Such a move would likely target $0.302 next, where the 50-day EMA converges with psychological resistance. The cross-chain integration developments and tokenized finance partnerships provide the fundamental backdrop that could sustain buying pressure beyond a typical oversold bounce.
The bearish scenario triggers if XLM fails to hold $0.254 on a daily close. Breaking this six-time tested support would expose the June lows near $0.240, potentially creating a liquidity cascade as stop-losses trigger. This would trap recent buyers attracted by the ecosystem developments and likely postpone any recovery attempts until sub-$0.25 levels.
Given the oversold RSI, extreme ADX readings signaling trend exhaustion, and timely fundamental catalysts from THORWallet and Turbo Energy partnerships, the most probable near-term path sees XLM consolidating between $0.254-$0.292 while building energy for a relief rally. The confluence of technical oversold conditions with expanding real-world utility creates an asymmetric risk-reward setup favoring patient accumulation over aggressive shorting at these levels.