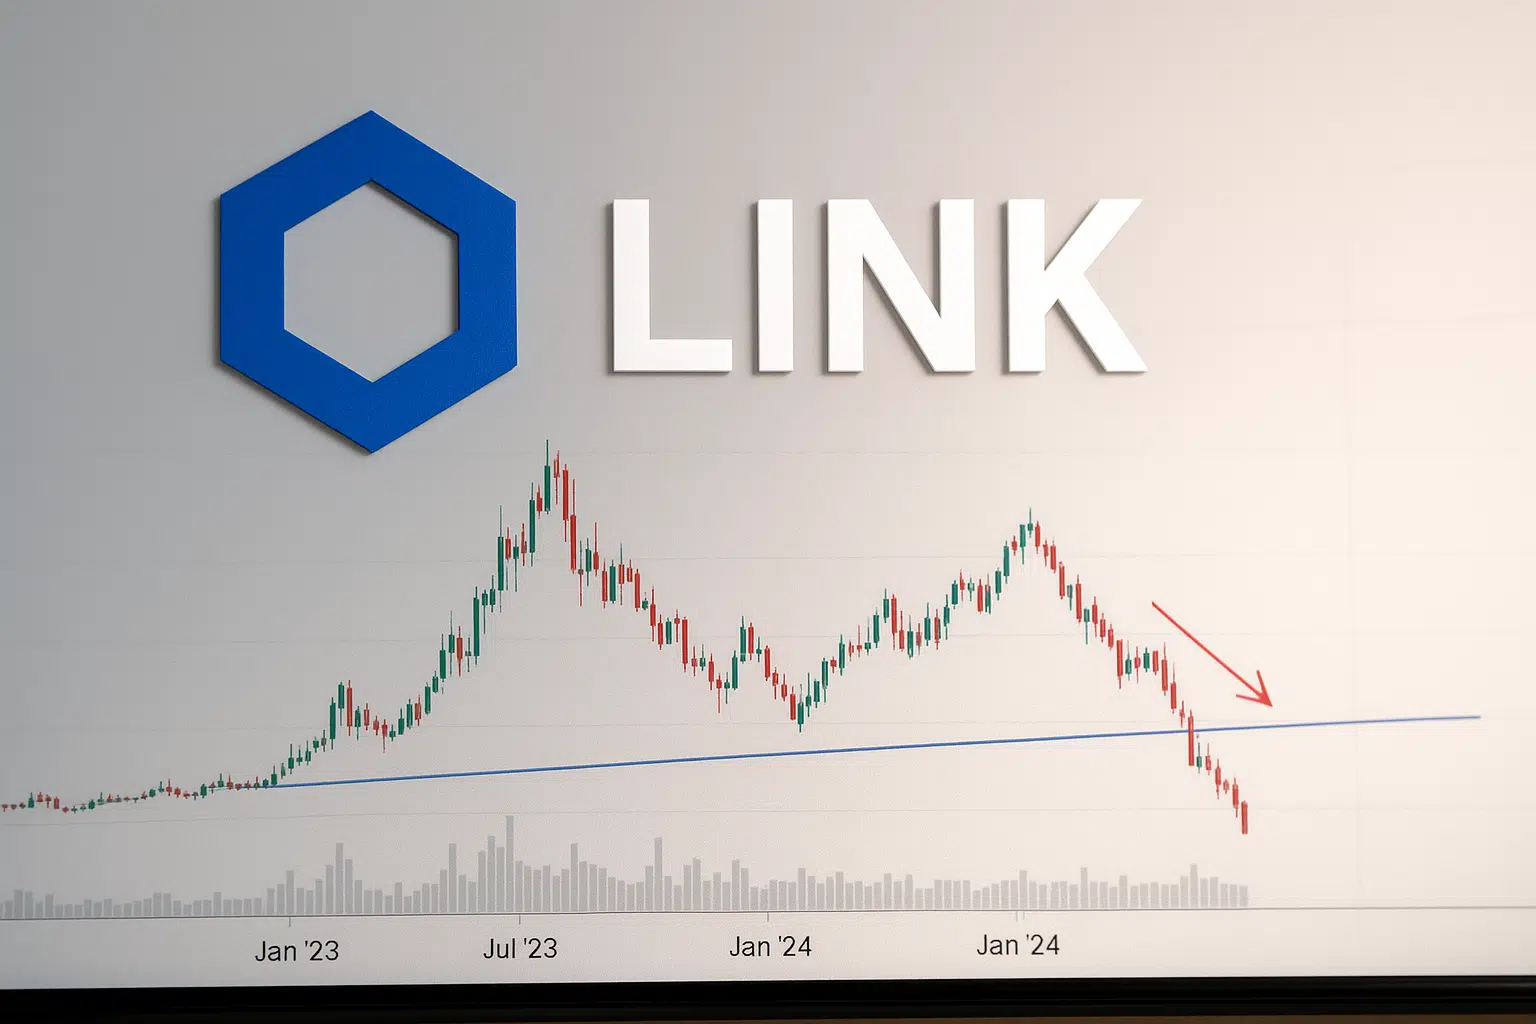
Chainlink Tests Critical Support as Exchange Supply Hits 2-Year Low
Market Structure Shifts Lower
- LINK shed 23.9% in December, erasing November’s gains despite bullish supply dynamics
- Exchange reserves plummet to 2-year lows while institutional partnerships expand
- Technical indicators flash oversold signals near make-or-break support at $13.50
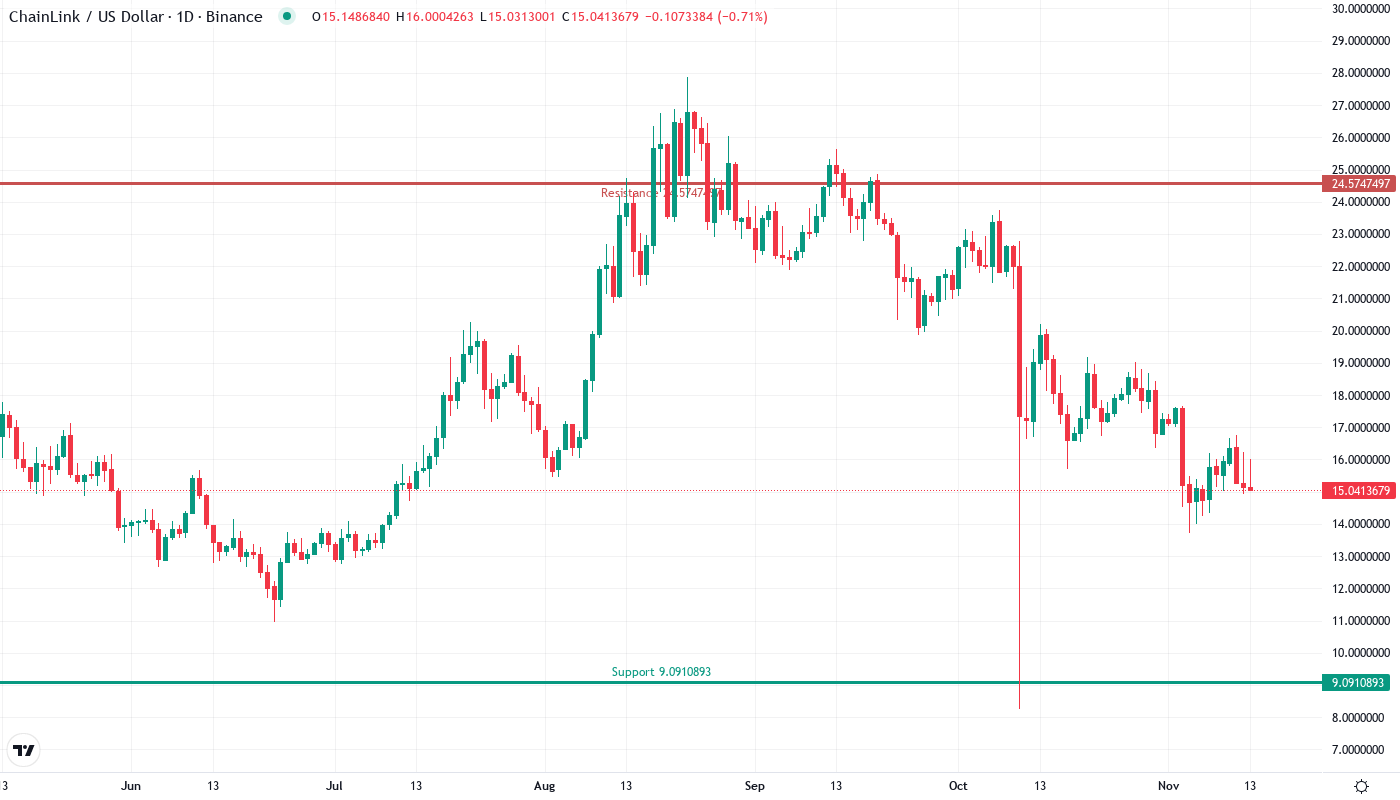
Chainlink’s price action tells a sobering story despite fundamentally bullish developments. The oracle network’s token tumbled from December highs of $19.25 to current levels near $15.12, representing a devastating 23.9% monthly decline that wiped out the entire November rally. What’s particularly interesting is how this selloff materialized even as exchange supplies hit 2-year lows – typically a bullish signal indicating holder conviction. The main question for traders is: will the combination of oversold technicals and improving fundamentals finally halt this decline at crucial support?
| Metric | Value |
|---|---|
| Asset | CHAINLINK (LINK) |
| Current Price | $15.12 |
| Weekly Performance | 0.27% |
| Monthly Performance | -23.93% |
| RSI (Relative Strength Index) | 39.3 |
| ADX (Average Directional Index) | 40.4 |
| MACD (MACD Level) | -0.93 |
| CCI (Commodity Channel Index, 20-period) | -61.40 |
RSI at 39.32 Matches Previous Reversal Zones
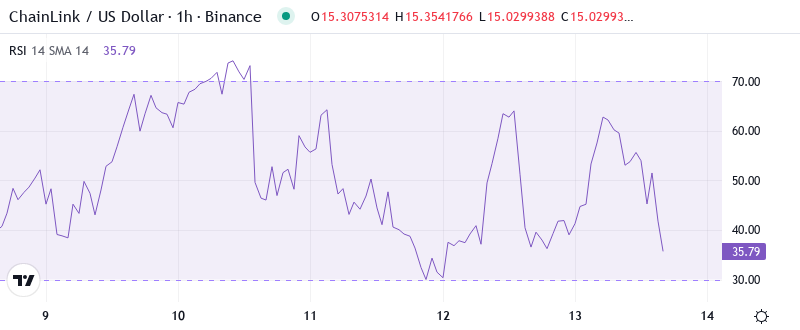
RSI sits at 39.32 on the daily timeframe, marking the first genuine oversold reading since the August washout that preceded a 40% recovery rally. This momentum exhaustion arrives precisely as LINK tests the psychological $15 level, creating a potential inflection point that historically attracted bargain hunters.
Looking at prior patterns, similar RSI configurations below 40 coincided with significant bottoms in May, August, and October – each time sparking rebounds of at least 25%. So for swing traders, this oversold bounce setup gains credibility from the confluence of technical exhaustion meeting fundamental catalysts like Grayscale’s amended ETF filing and expanding enterprise adoption through partnerships with Global Layer One and Monaco.
ADX Drops Below 20 as Trend Exhaustion Sets In
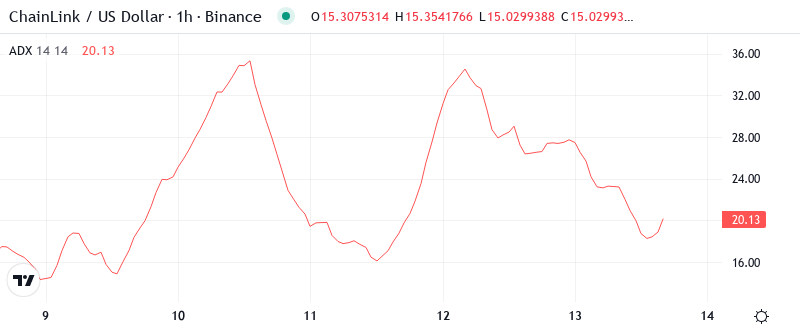
Trend strength indicators paint an equally revealing picture. ADX reads 40.36, but the dramatic divergence between directional indicators (+DI at 11.73 versus -DI at 26.08) signals seller exhaustion after the month-long decline. Basically, the trending conditions that enabled December’s sharp drop are losing steam.
What stands out here is how rapidly ADX climbed from November’s sub-25 readings to current levels above 40 – matching the velocity seen during capitulation phases. Therefore, day traders should prepare for a potential volatility squeeze as the market transitions from trending to ranging conditions, particularly with exchange supply dynamics creating a supply shortage that could amplify any reversal.
20-Day EMA at $16.29 Becomes First Resistance Target
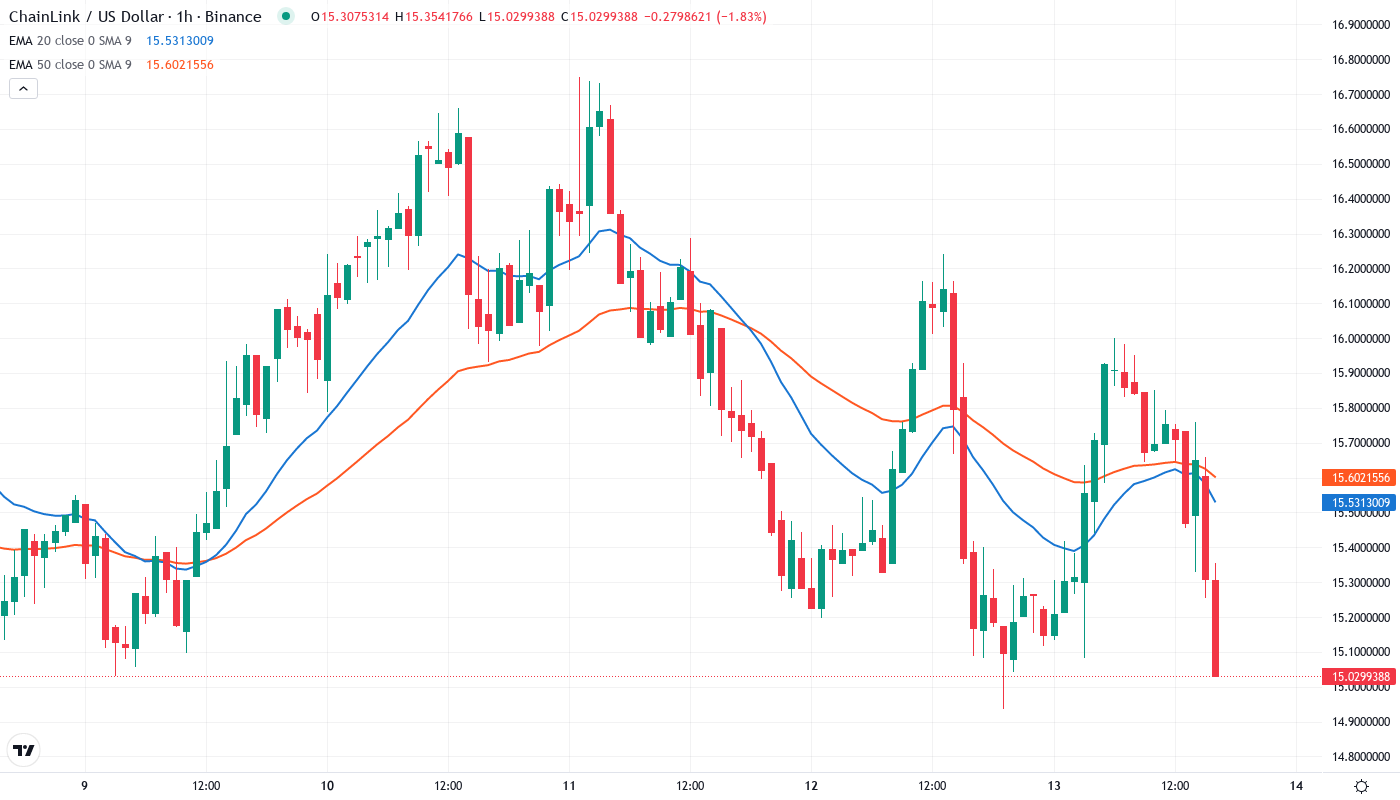
Price action through the EMA ribbons reveals the technical damage from December’s selloff. LINK currently trades below the entire moving average complex, with the 10-day EMA at $15.65 providing immediate overhead resistance, followed by the more significant 20-day at $16.29.
More telling is the compression between the 50-day ($16.96) and 100-day ($18.00) EMAs, which historically preceded explosive moves in either direction. The 200-day EMA sits distant at $18.84, roughly 25% above current levels – highlighting just how oversold conditions have become. Bulls need to reclaim the 20-day EMA convincingly to shift near-term momentum, while that former support area around $16.30 now transforms into the first major hurdle for any recovery attempt.
Support Stacks at $13.50 While Resistance Clusters Near $18
Immediate support emerges at the $13.71 weekly low, which aligns perfectly with the 2024 volume-weighted average price. This level has rejected sellers six times since June, making it a red line for bulls to defend. Below that, the psychological $13.50 level coincides with the 0.786 Fibonacci retracement of the 2023-2024 rally.
Resistance stacks heavy between $16.30 (20-day EMA) and $17.00 (50-day EMA), with December’s volume point of control at $17.25 likely capping any initial recovery attempts. The monthly pivot at $16.45 sits right in the middle of this resistance zone, creating a gauntlet for bulls to navigate.
This market structure suggests accumulation near current levels, particularly given the 2-year low in exchange reserves. The confluence of technical support at $13.50-$13.70 with fundamental catalysts like potential ETF approval creates an asymmetric risk-reward setup favoring patient buyers over panic sellers.
Bulls Target 20-Day EMA Reclaim as Exchange Shortage Deepens
Bulls require a daily close above $16.30 to neutralize the immediate bearish pressure and target the 50-day EMA at $17.00. The combination of oversold technicals, record-low exchange supplies, and expanding institutional adoption through Grayscale’s ETF initiative provides the fundamental fuel for such a recovery.
Bearish continuation triggers on a daily close below $13.50, which would likely flush positions toward the yearly support at $11.80. Such a breakdown would invalidate the accumulation thesis and suggest deeper fundamental concerns outweigh the positive supply dynamics.
Given the oversold RSI, exhausted ADX readings, and critical support test coinciding with multi-year lows in exchange supply, the most probable near-term outcome involves a relief bounce toward the $16.30-$17.00 resistance cluster before the market determines its next major directional move.